Greendot Analytics is a digital solution designed to enhance wound care in the Australian aged care sector. The platform includes a mobile app for front-line staff and an online portal for clinicians, working together to streamline the tracking, management, and analysis of wound healing. By improving data collection and insights, Greendot aims to drive better outcomes in wound care and support more informed decision-making.

Wounds are a silent epidemic within the Australian aged care sector. It has been estimated that each year billions of dollars are spent on wound care in acute, primary and residential aged care settings. Studies have shown that much of this cost is due to inefficiency and waste. The cost associated with humanitarian suffering is even larger, mismanagement of wounds can lead to great physical pain, recurrent wounds, amputation and even death.
The current process of wound care can be particularly fragmented within aged care facilities. Wound management is often reliant on manually created care plans that are physically distributed among carers. The reliance on a paper system is notoriously inefficient and plagued by the following:
These drawbacks have real-life consequences when providing on-going treatment of the wounds of the elderly.
CollabCare, a Melbourne-based technology company specializing in digital health services, identified a market gap for a digital wound management solution through their previous work with aged care facilities. They called this application Greendot Analytics and envisioned a system to track, analyze, and request specialist help throughout the wound healing journey. As the product designer at the company, I was tasked with designing the solution.

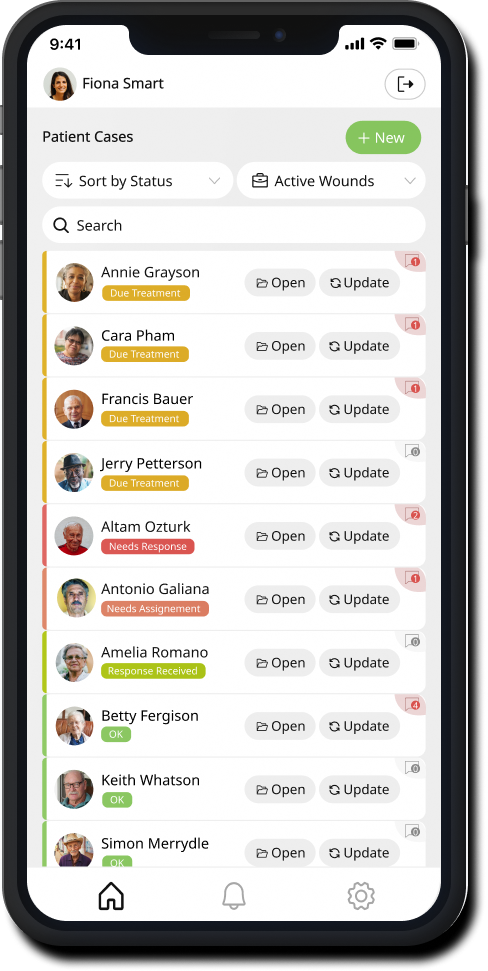
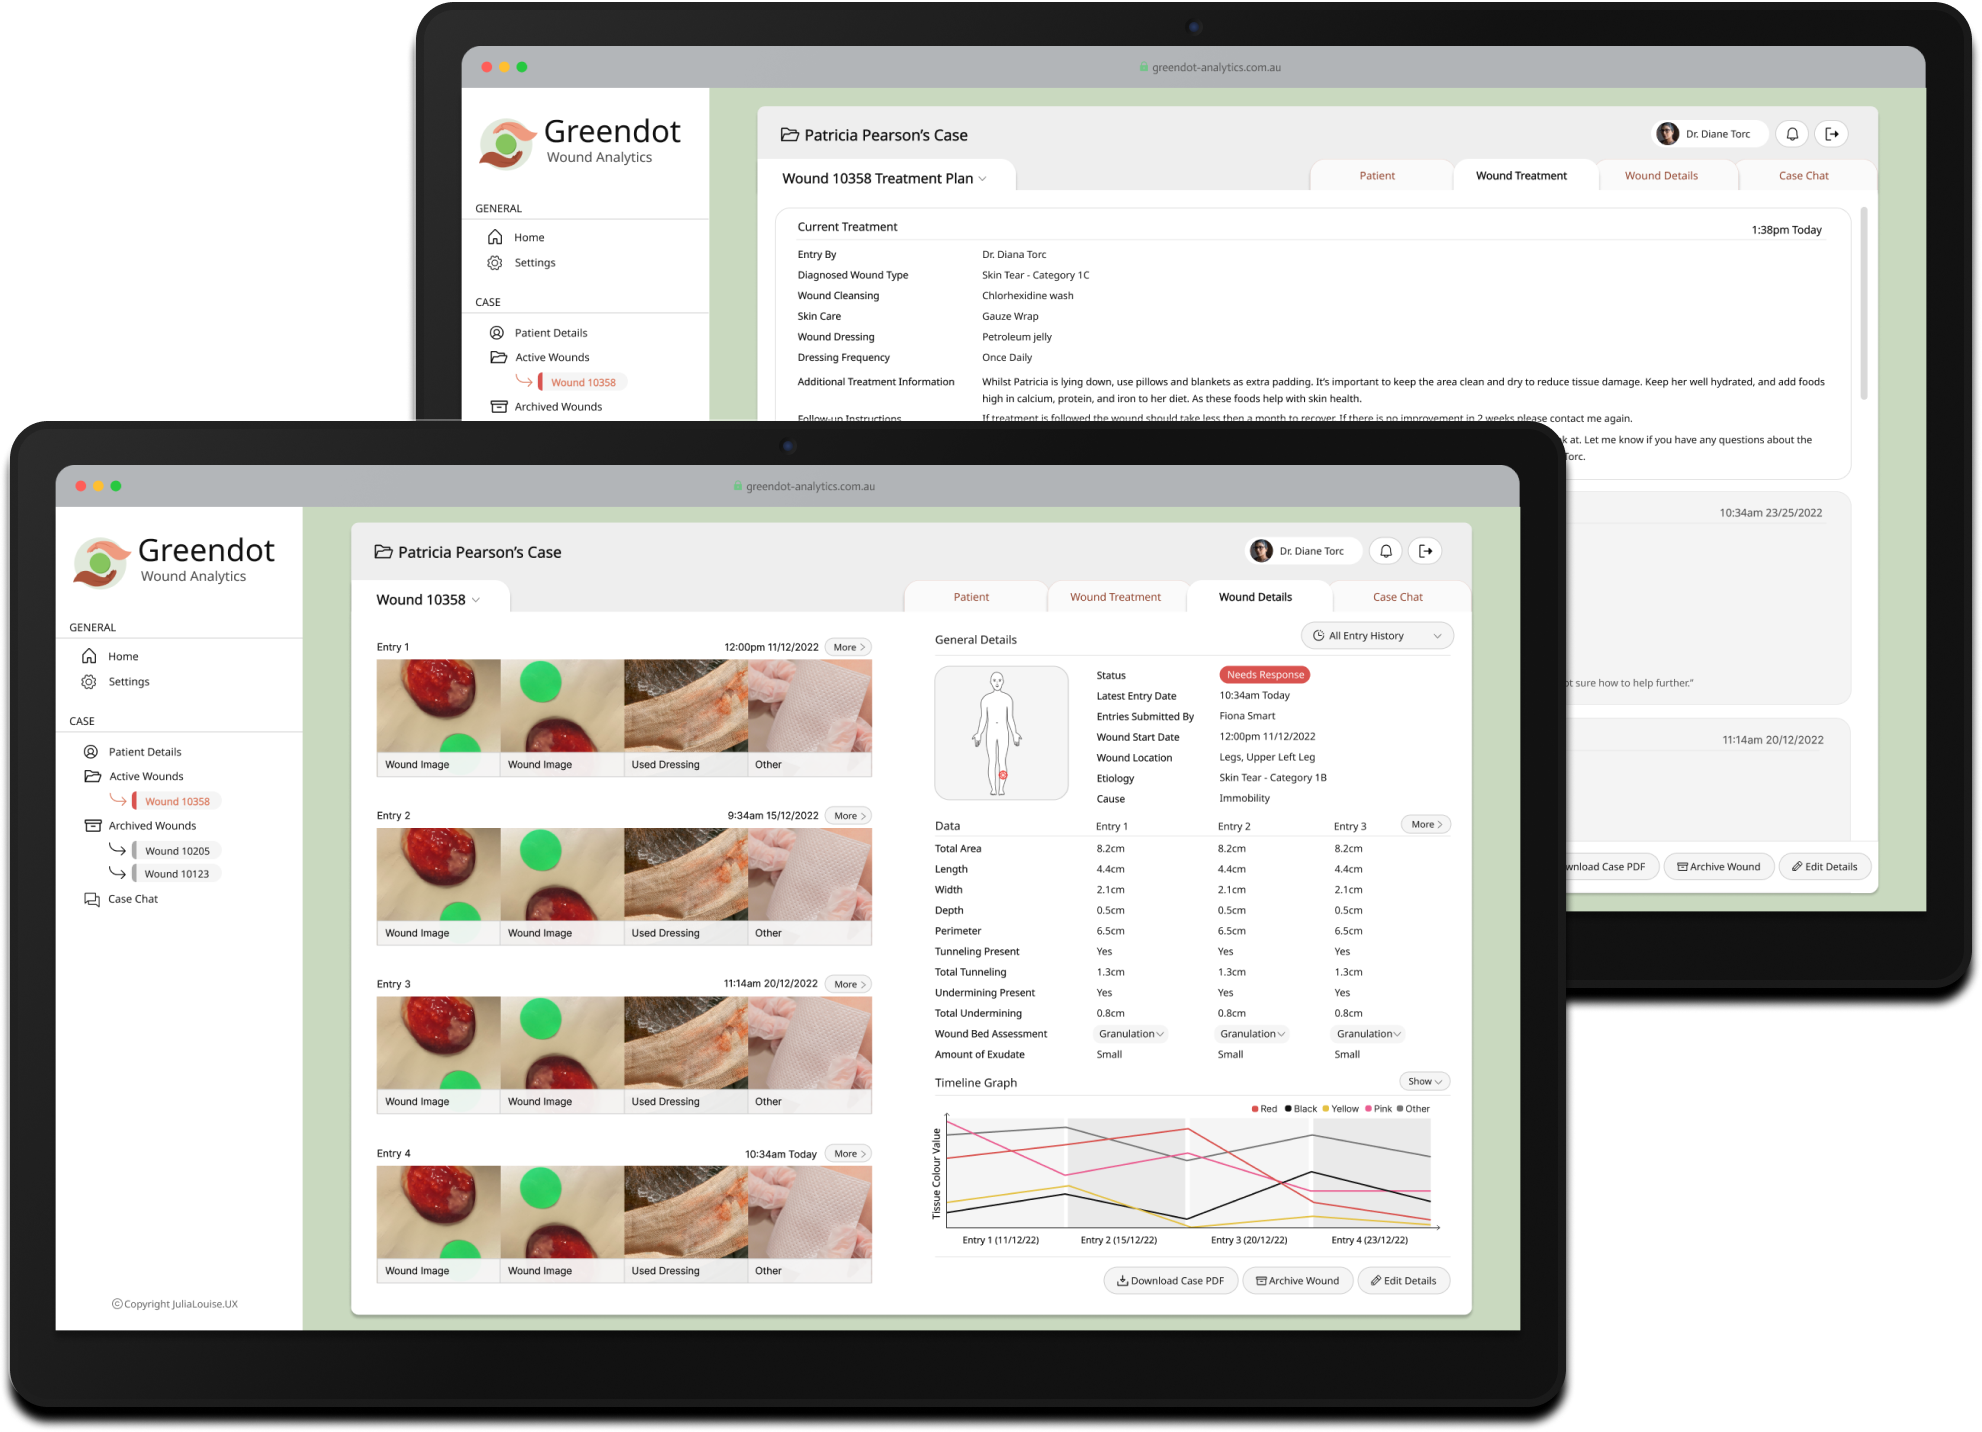
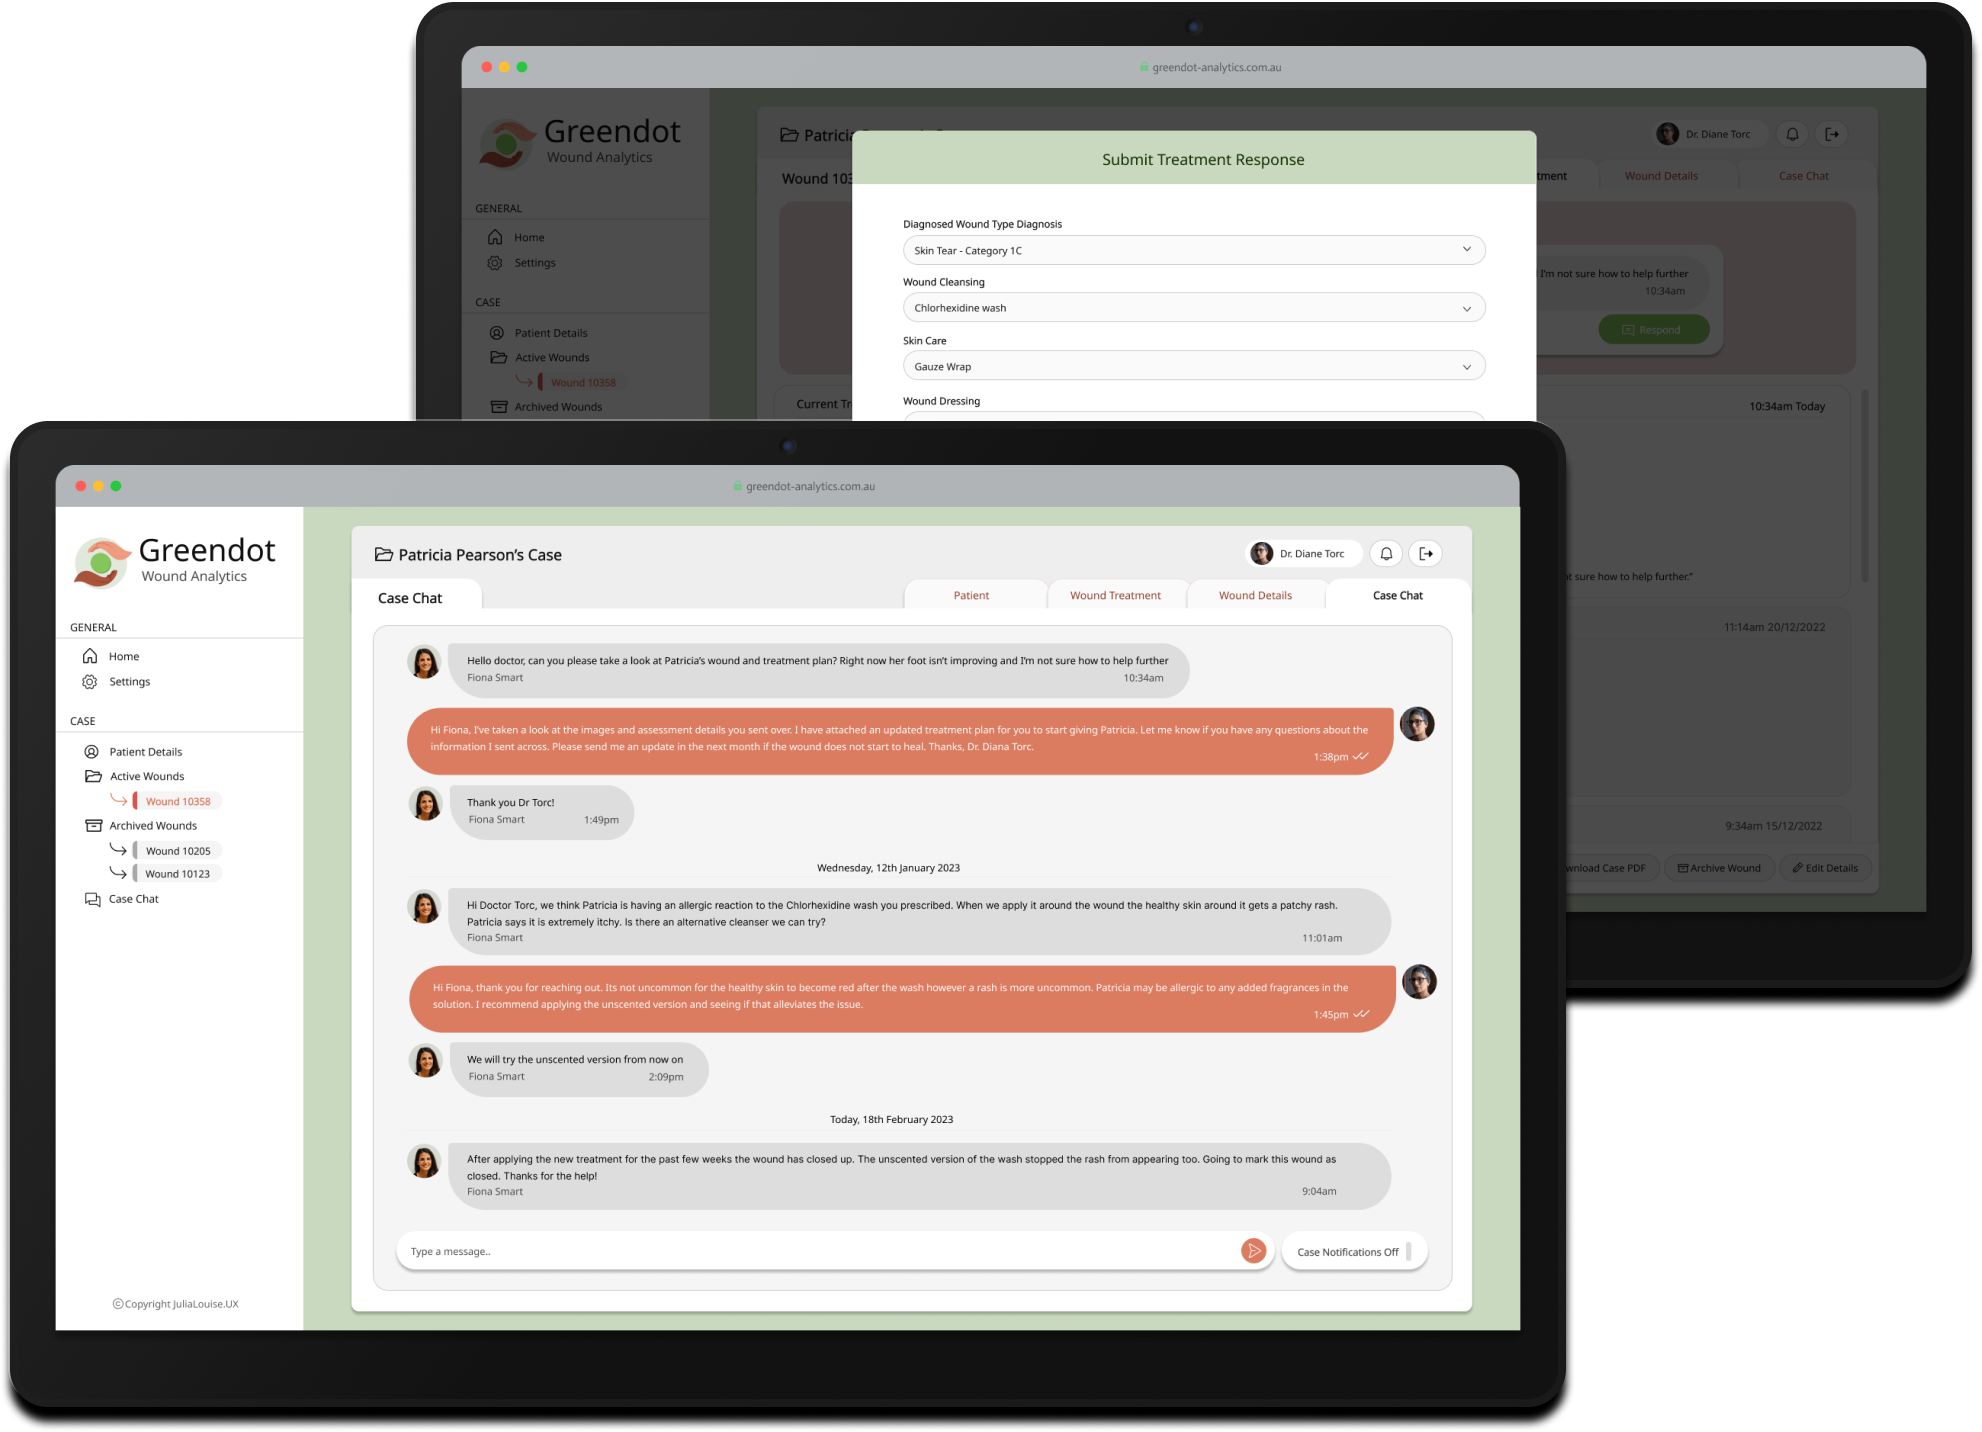
Case files allow front-line carers to view details about a patient's case, including medical data, wound details, and importantly wound treatment. This information serves as a vital reference while caring for residents and can be edited as needed, ensuring that the case file remains accurate with the latest information.
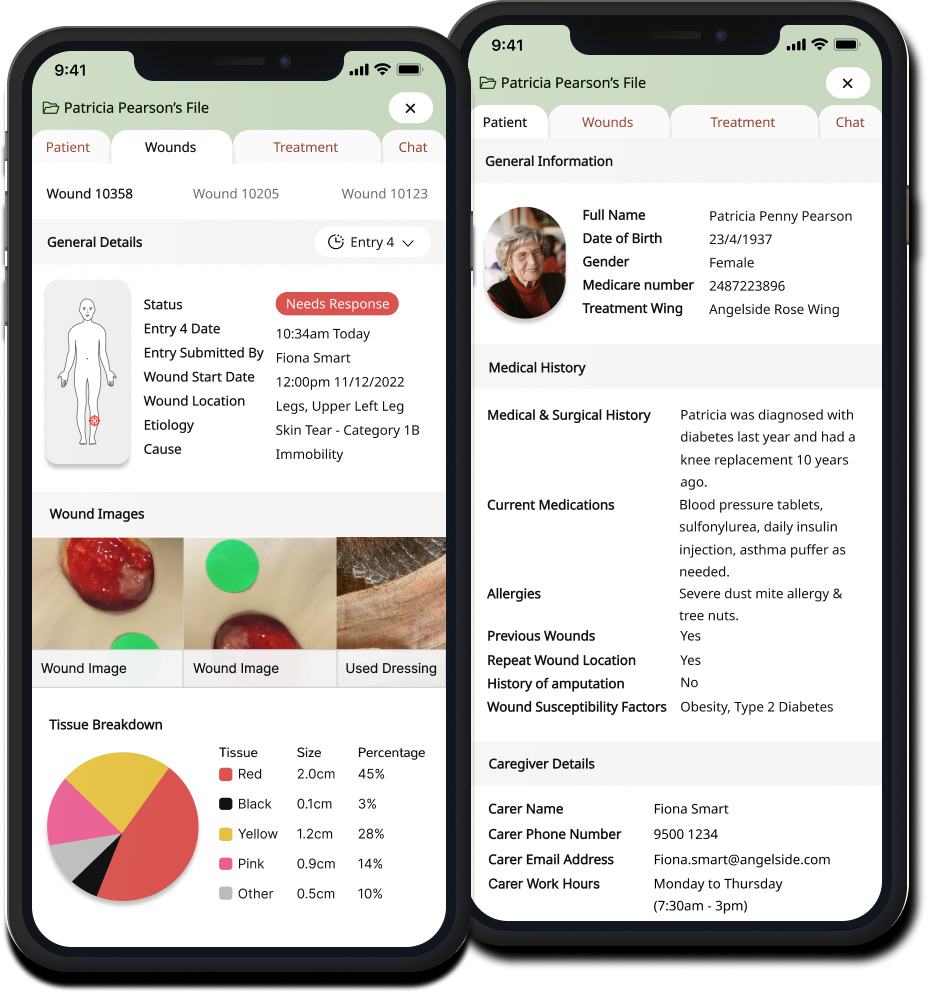
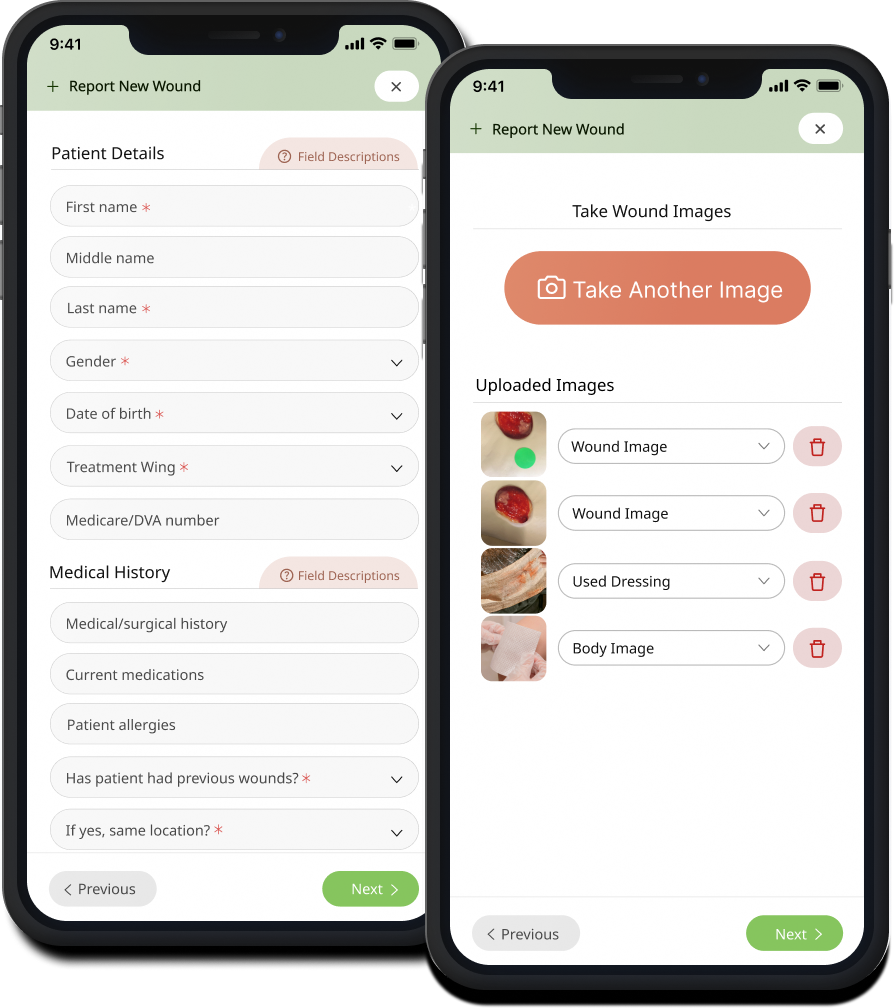
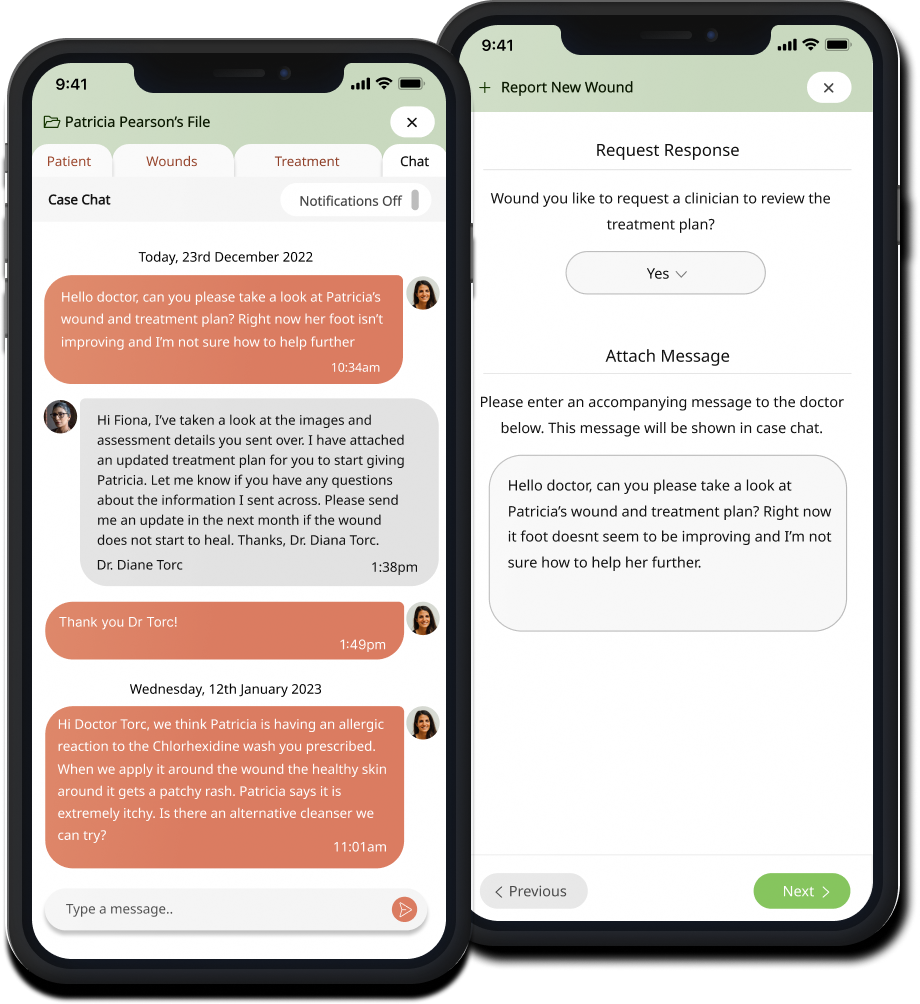
During the process of creating a case or submitting an update, front-line carers have the option to request a response from a clinician to get guidance on things like wound treatment or identification. The ongoing communication channel within a case also supports the continuous exchange of information throughout the wound treatment process, ensuring that all relevant details are shared and addressed effectively.
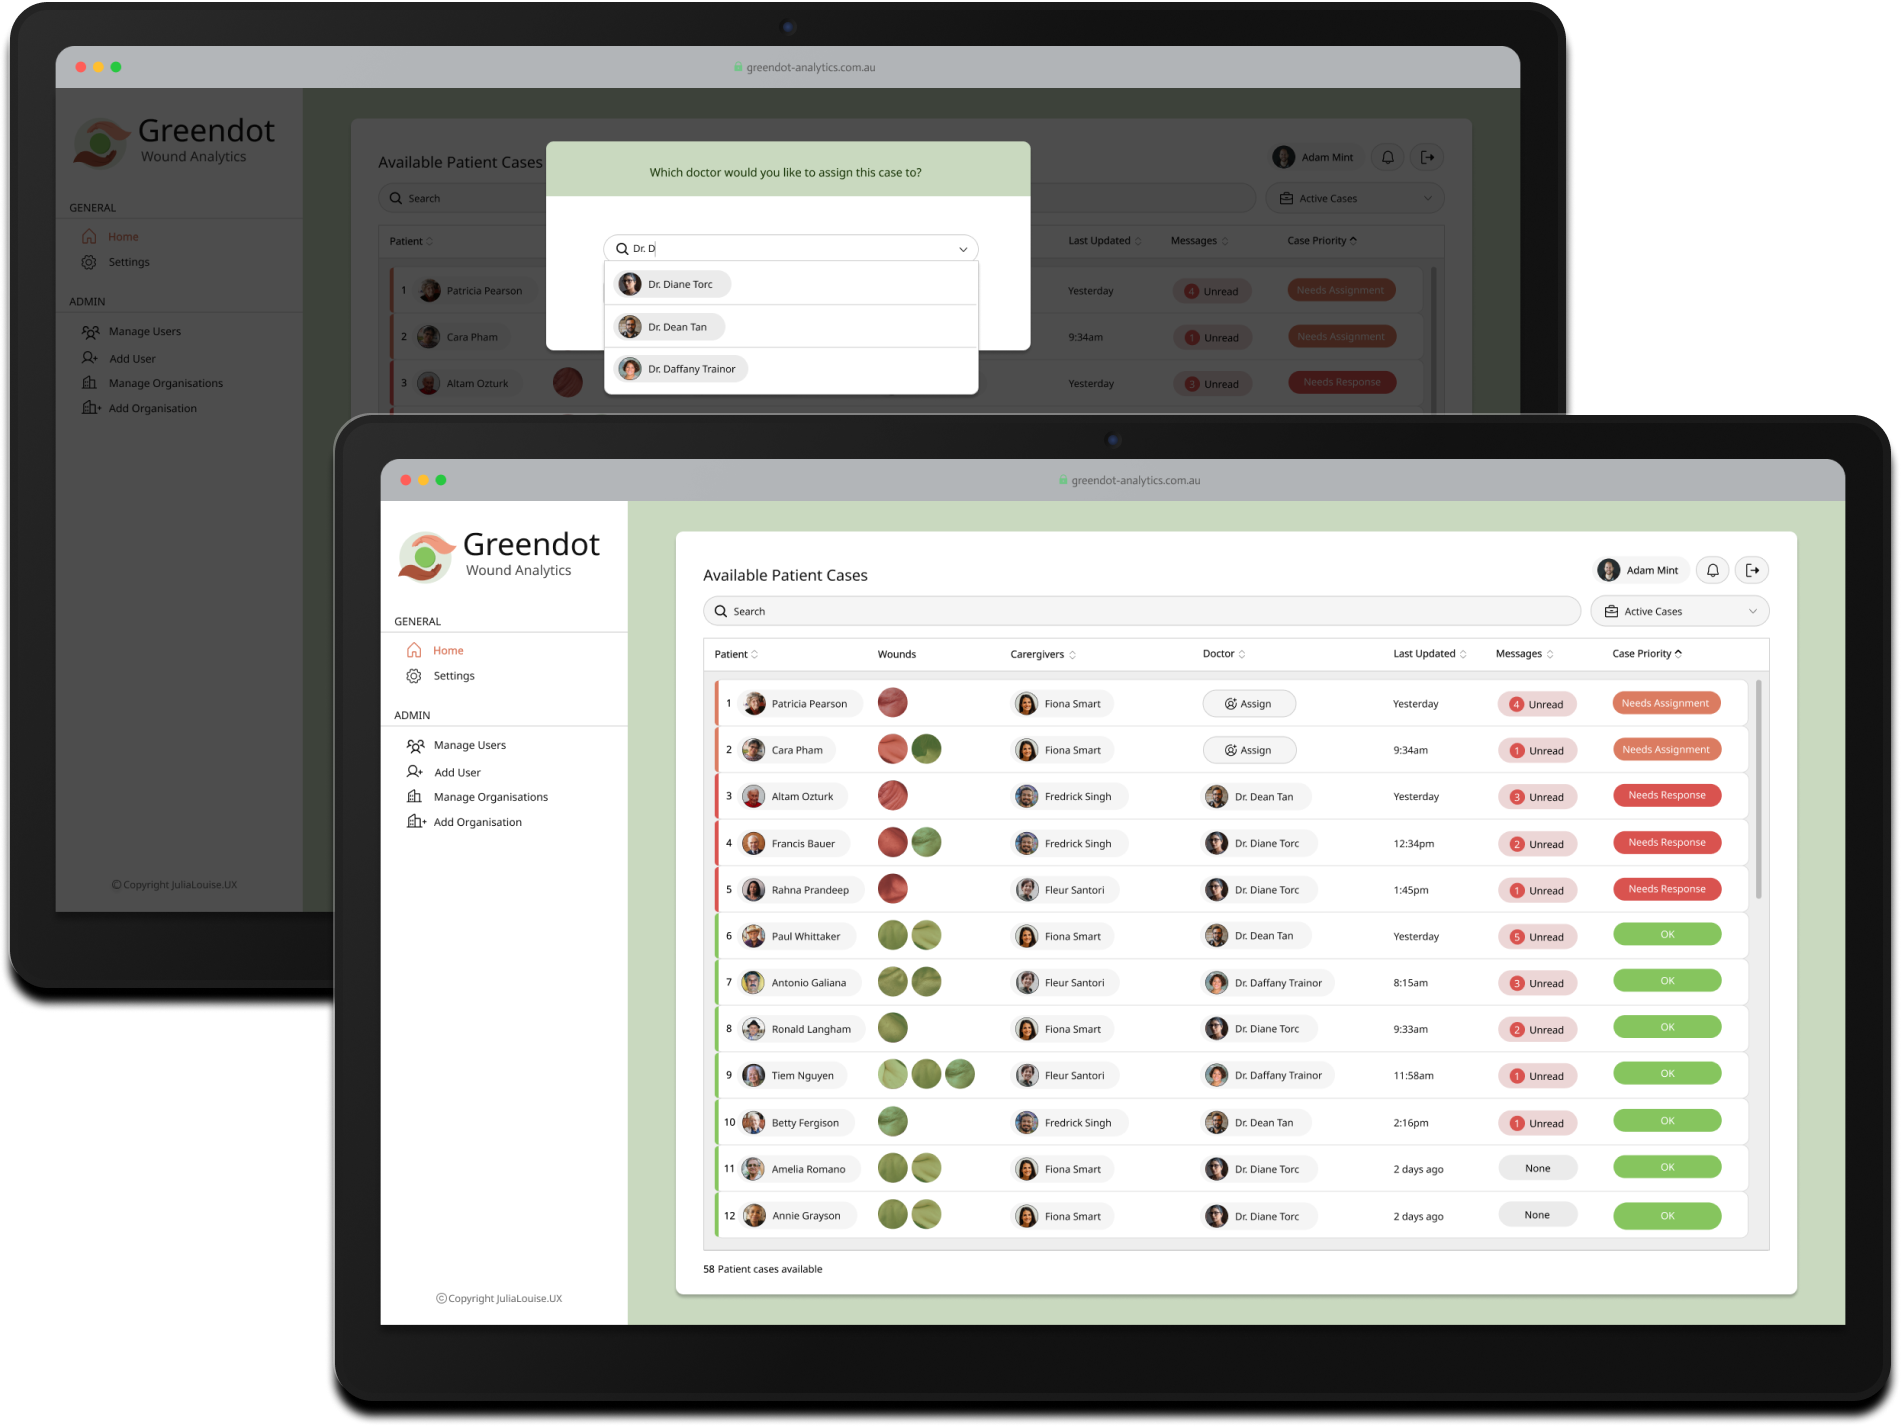
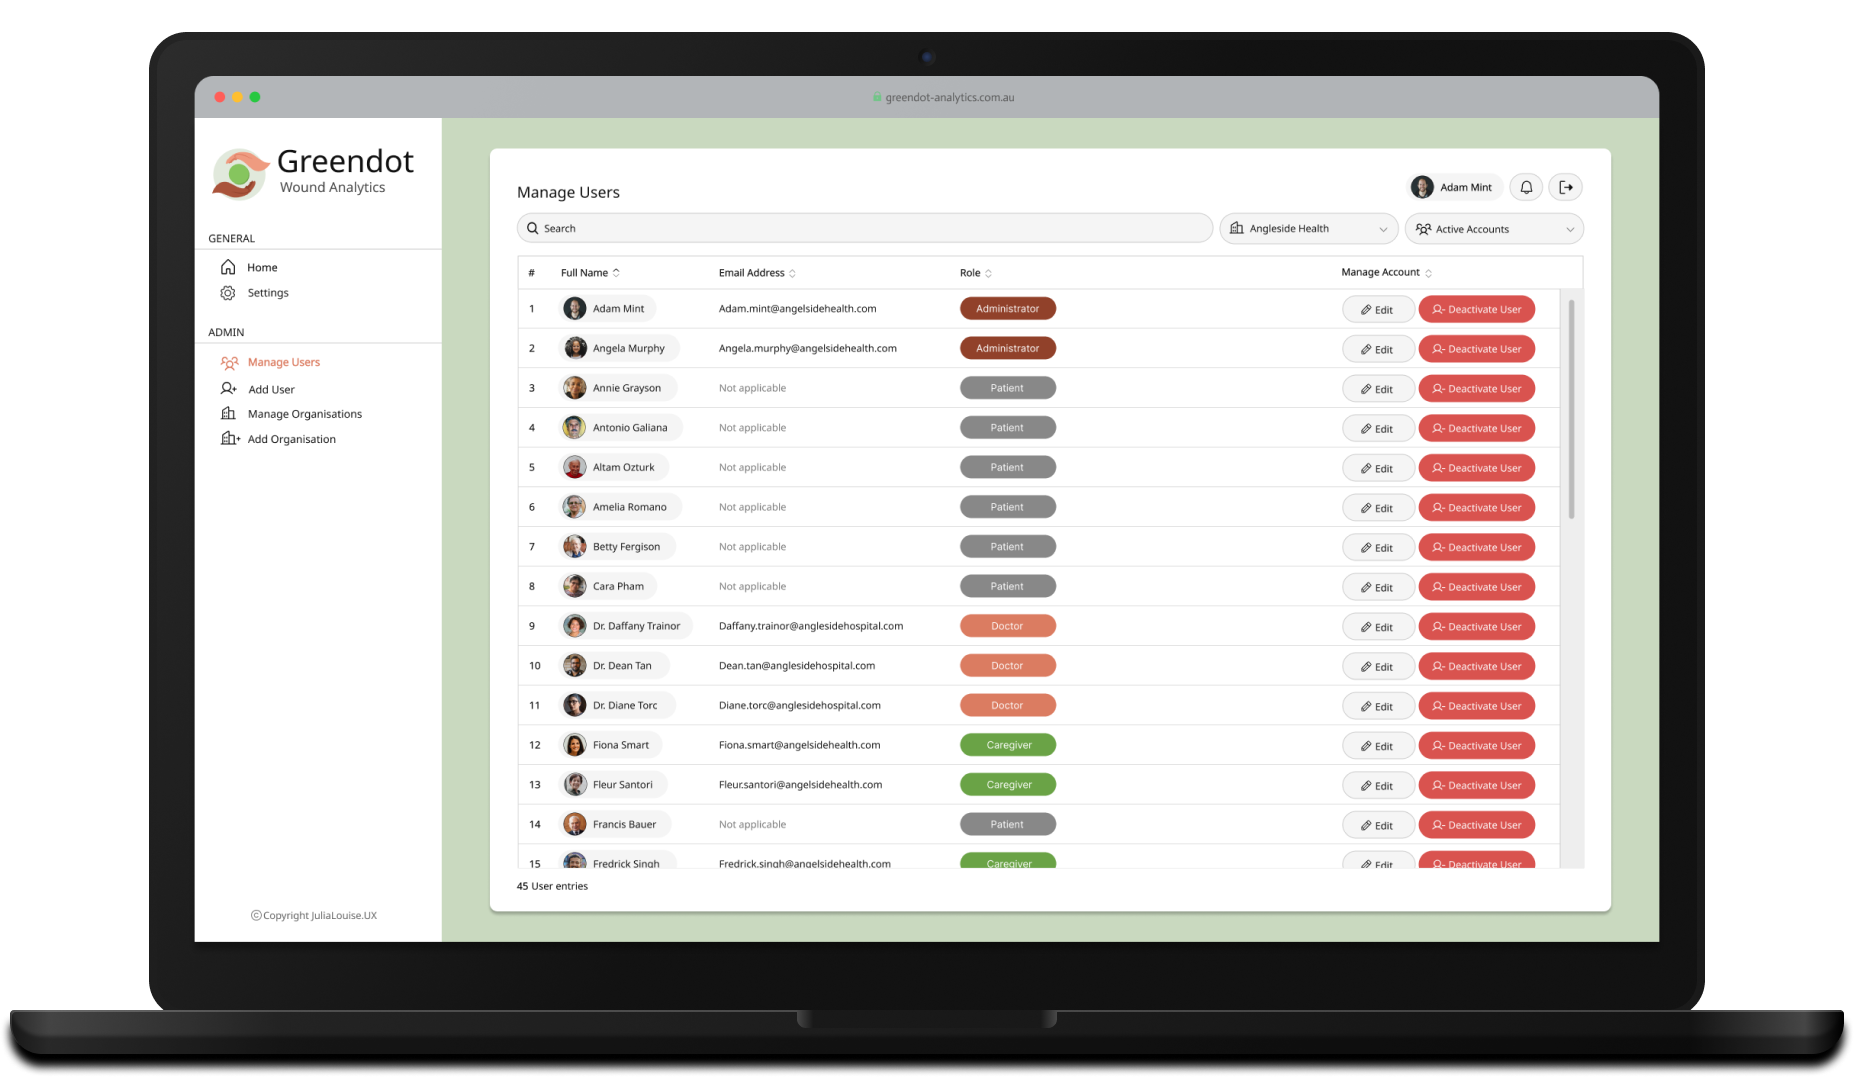
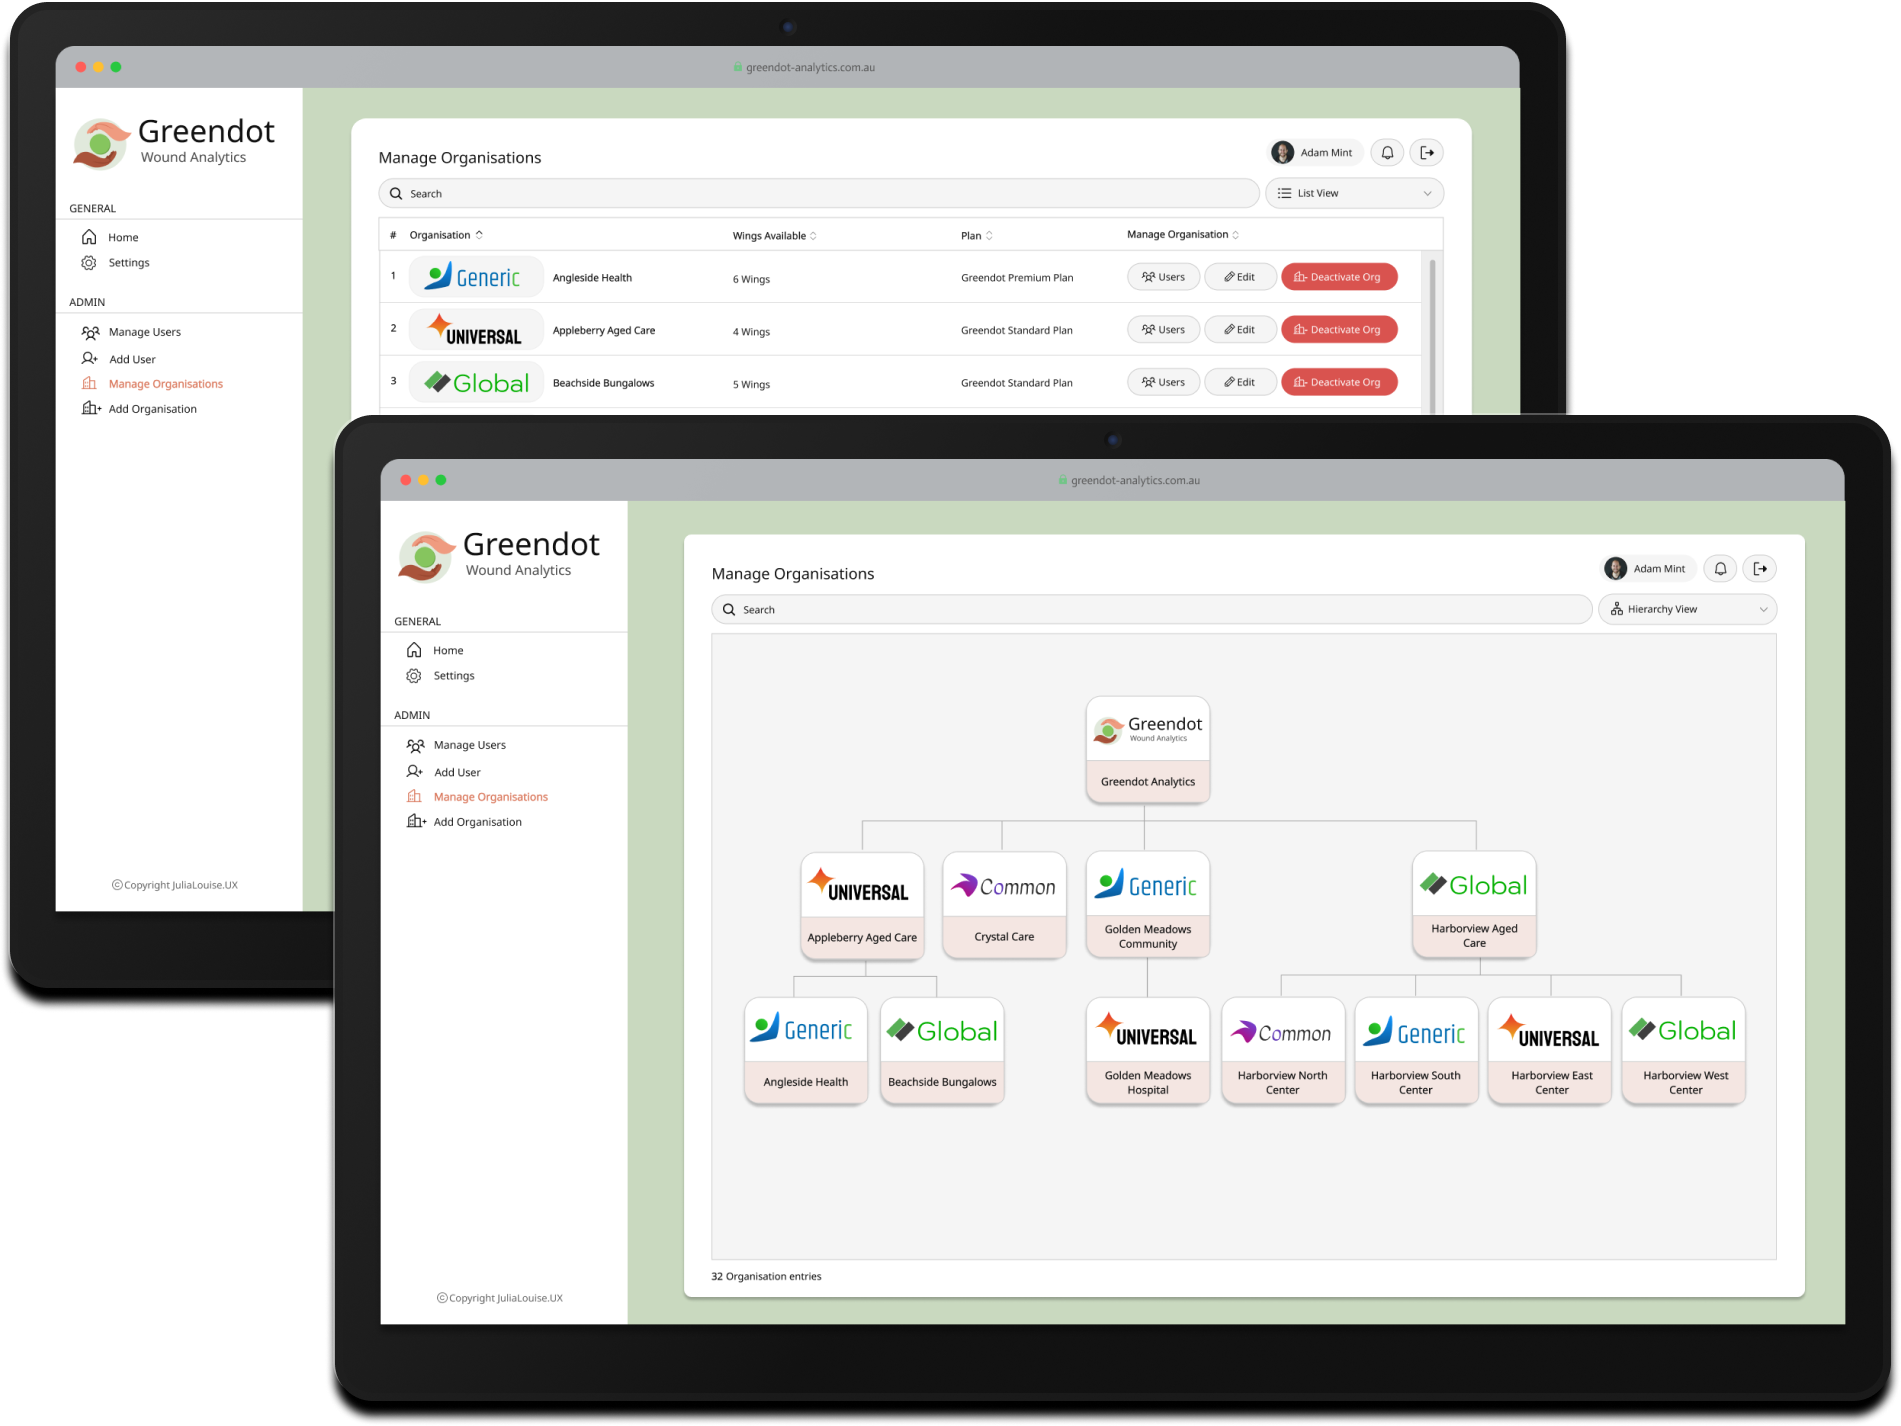
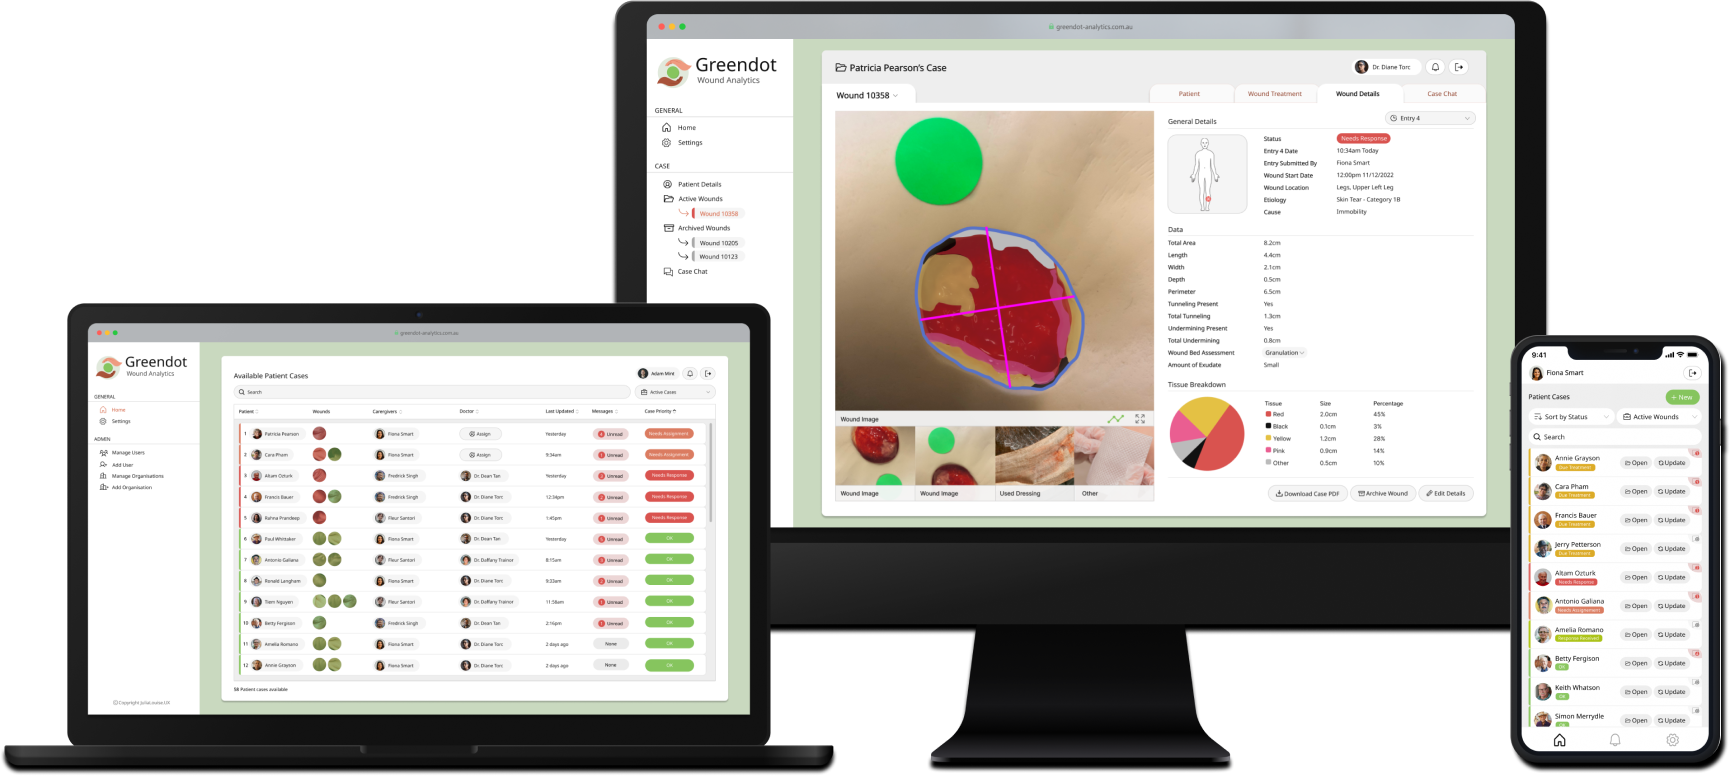
Coordinators have access to a user management system to add and manage all users across the platform. This powerful administration system leverages user roles to dynamically display relevant functionality and enforce appropriate security and privacy levels. For example, clinicians can access patient case files directly from their dashboard, while Coordinators can assign doctors to specific cases.
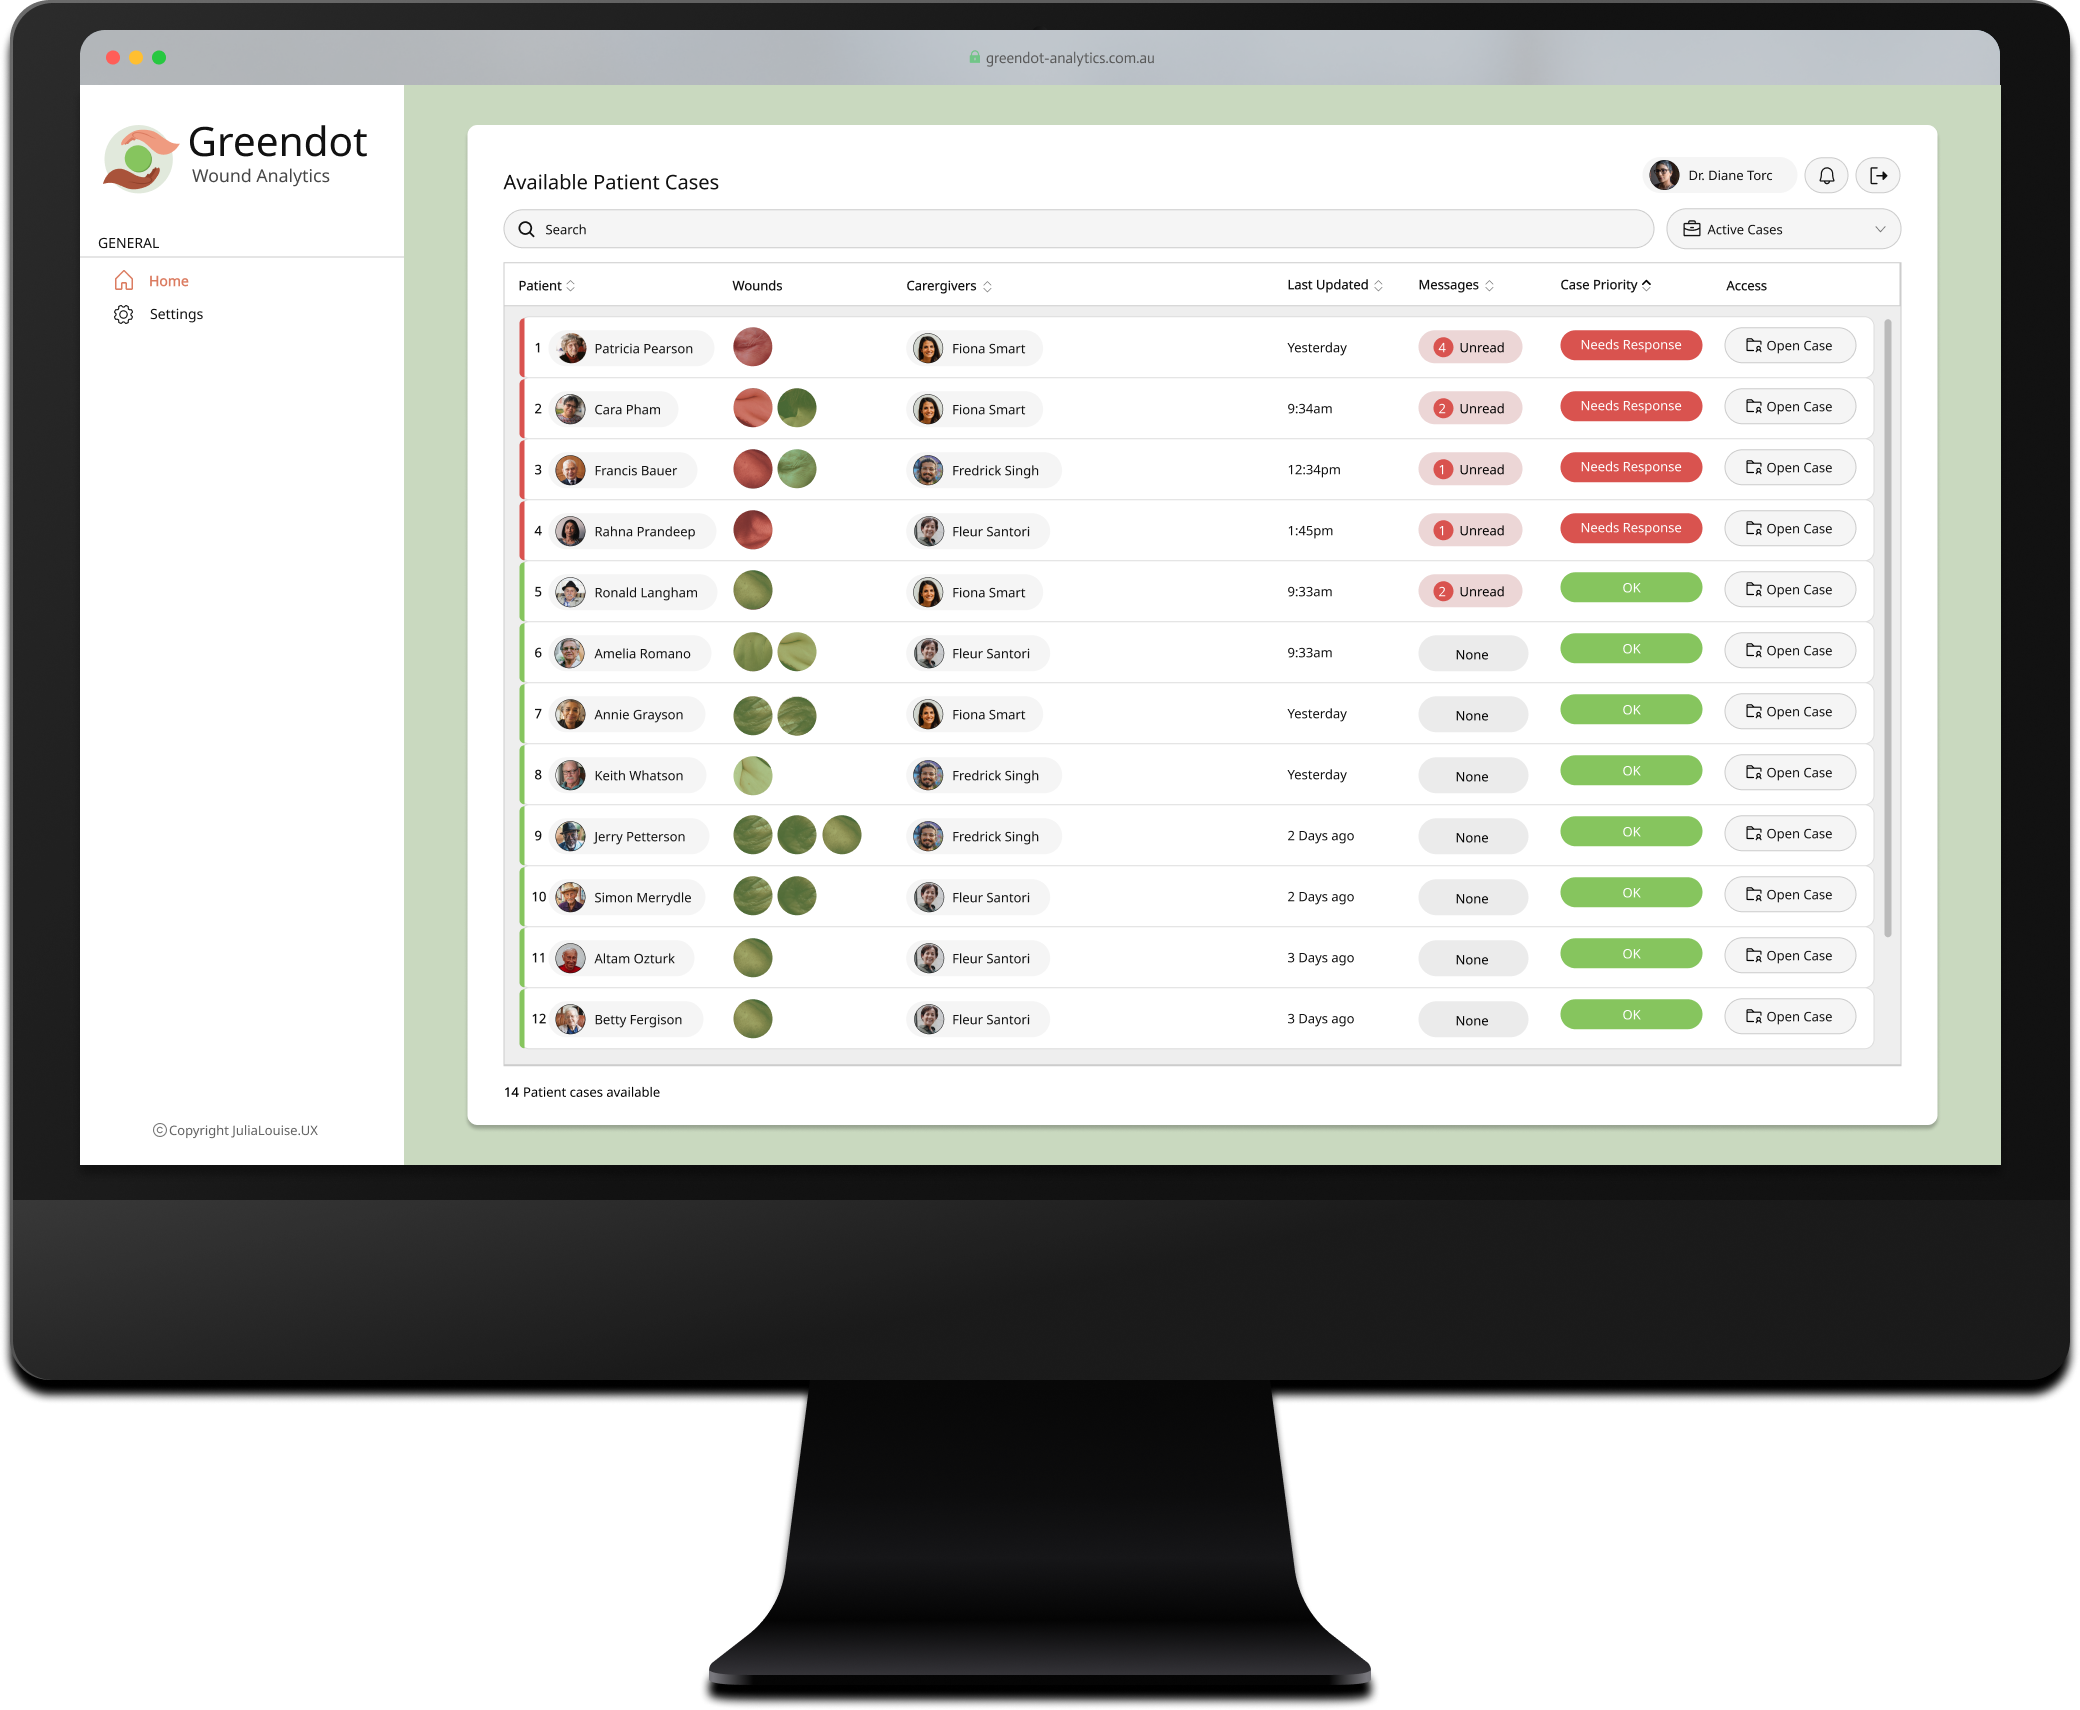
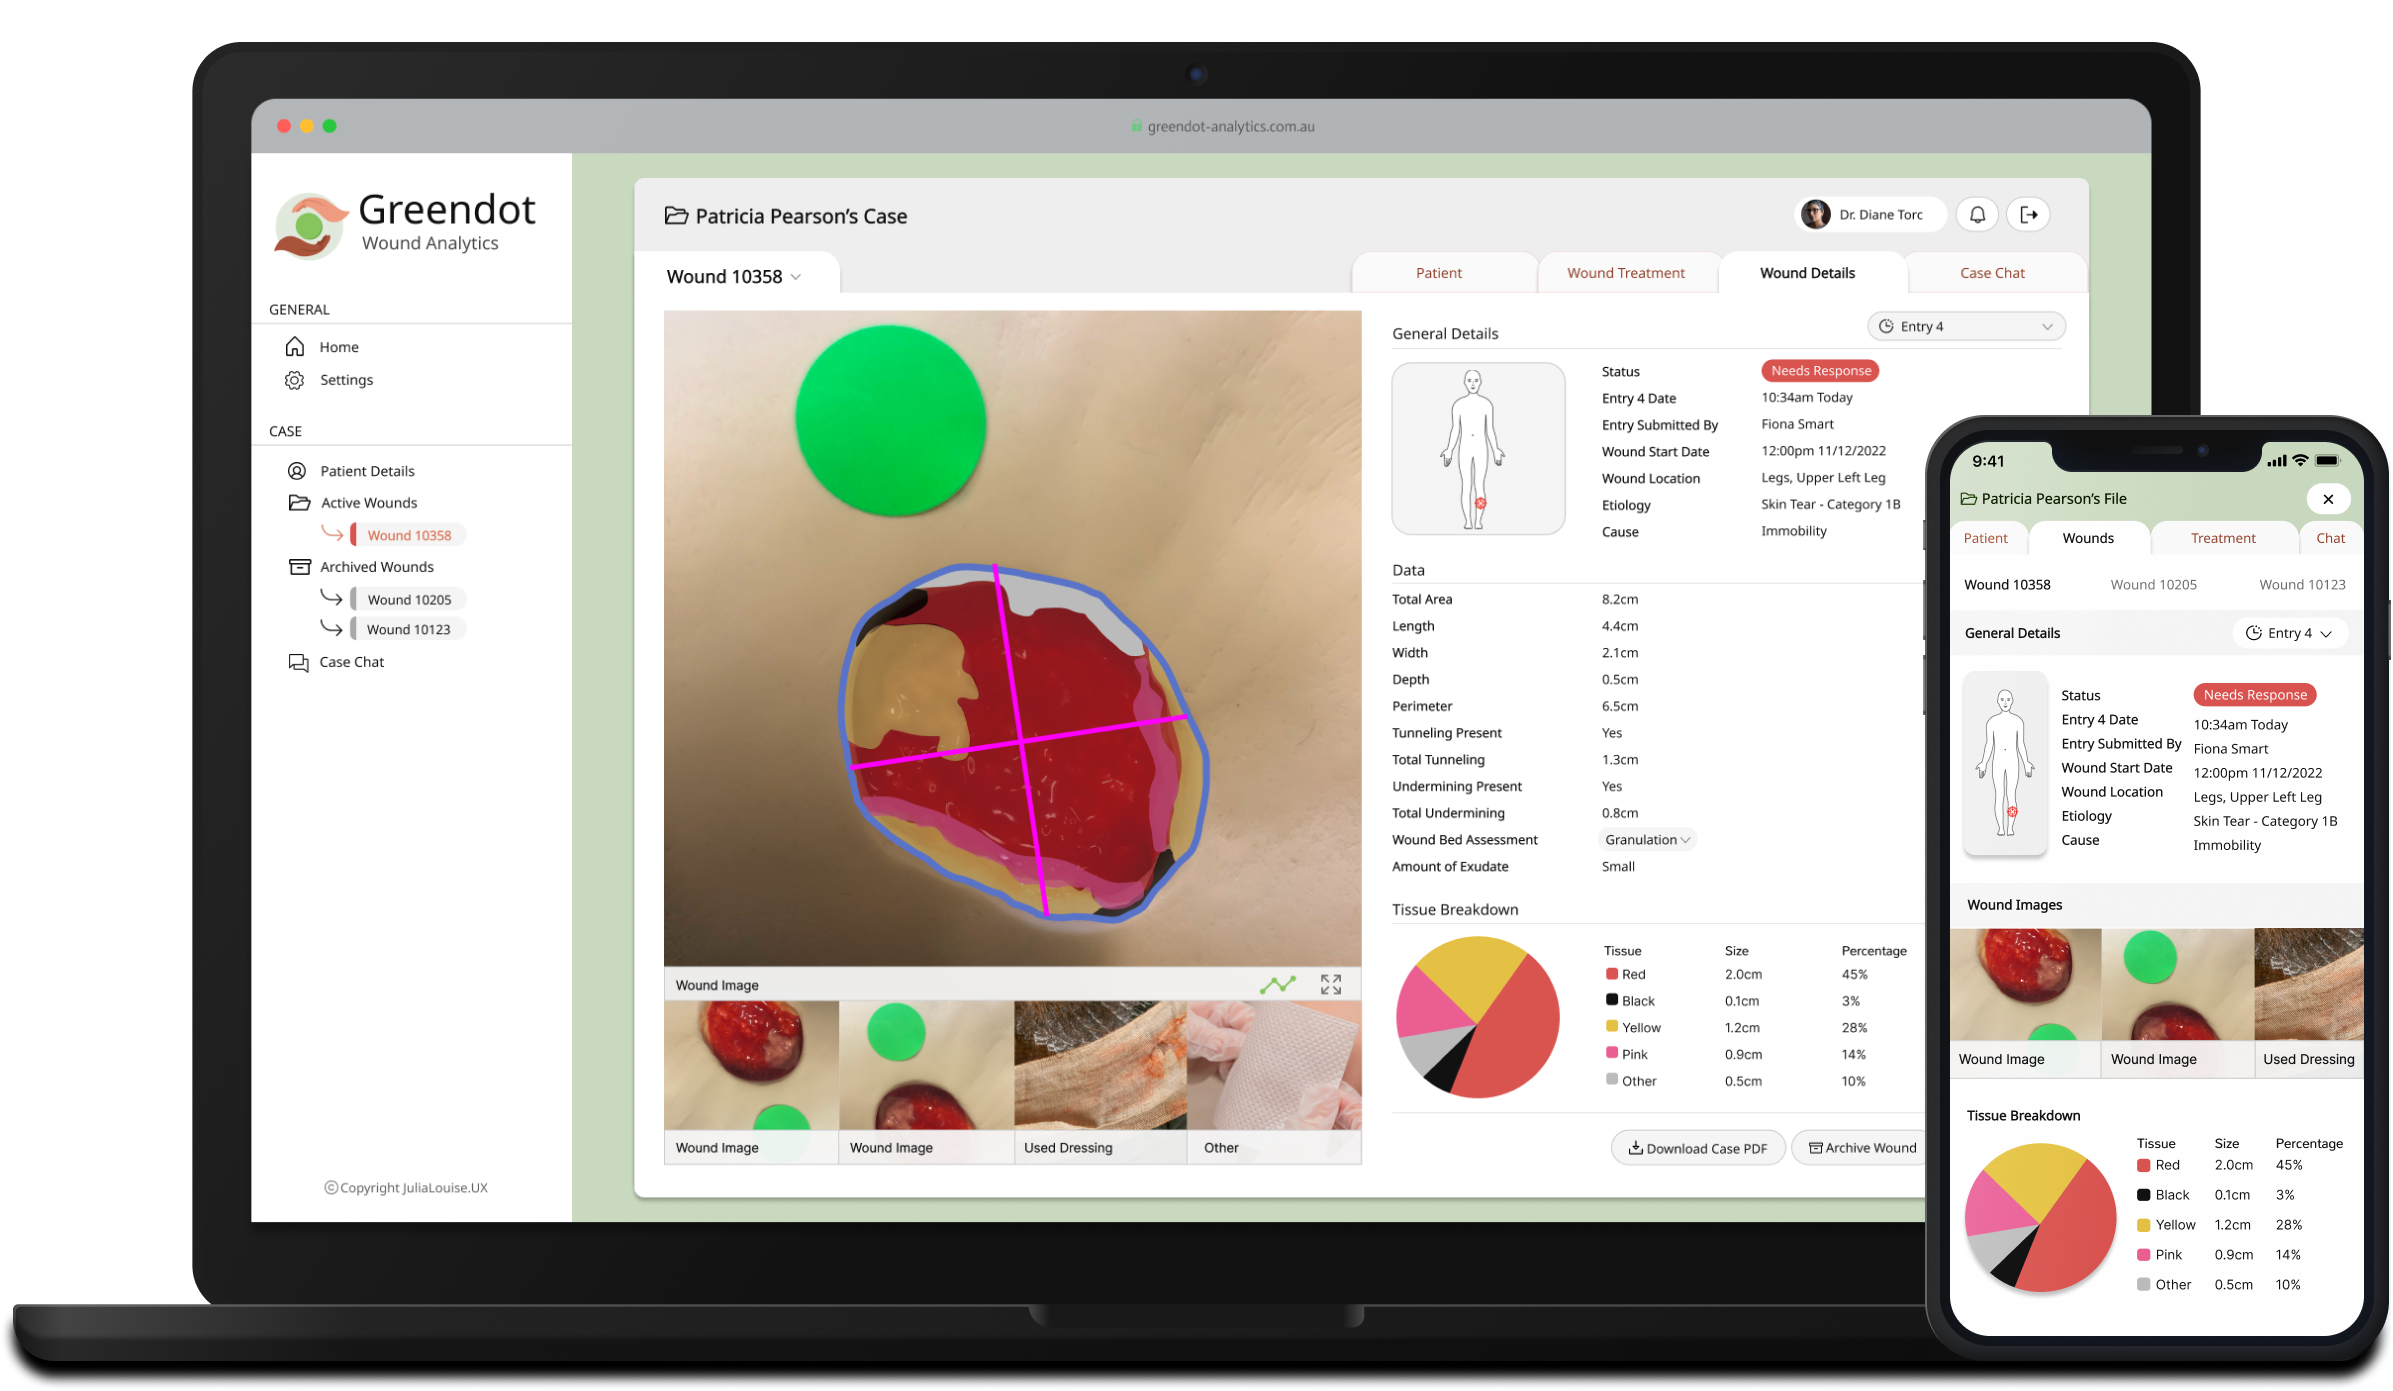
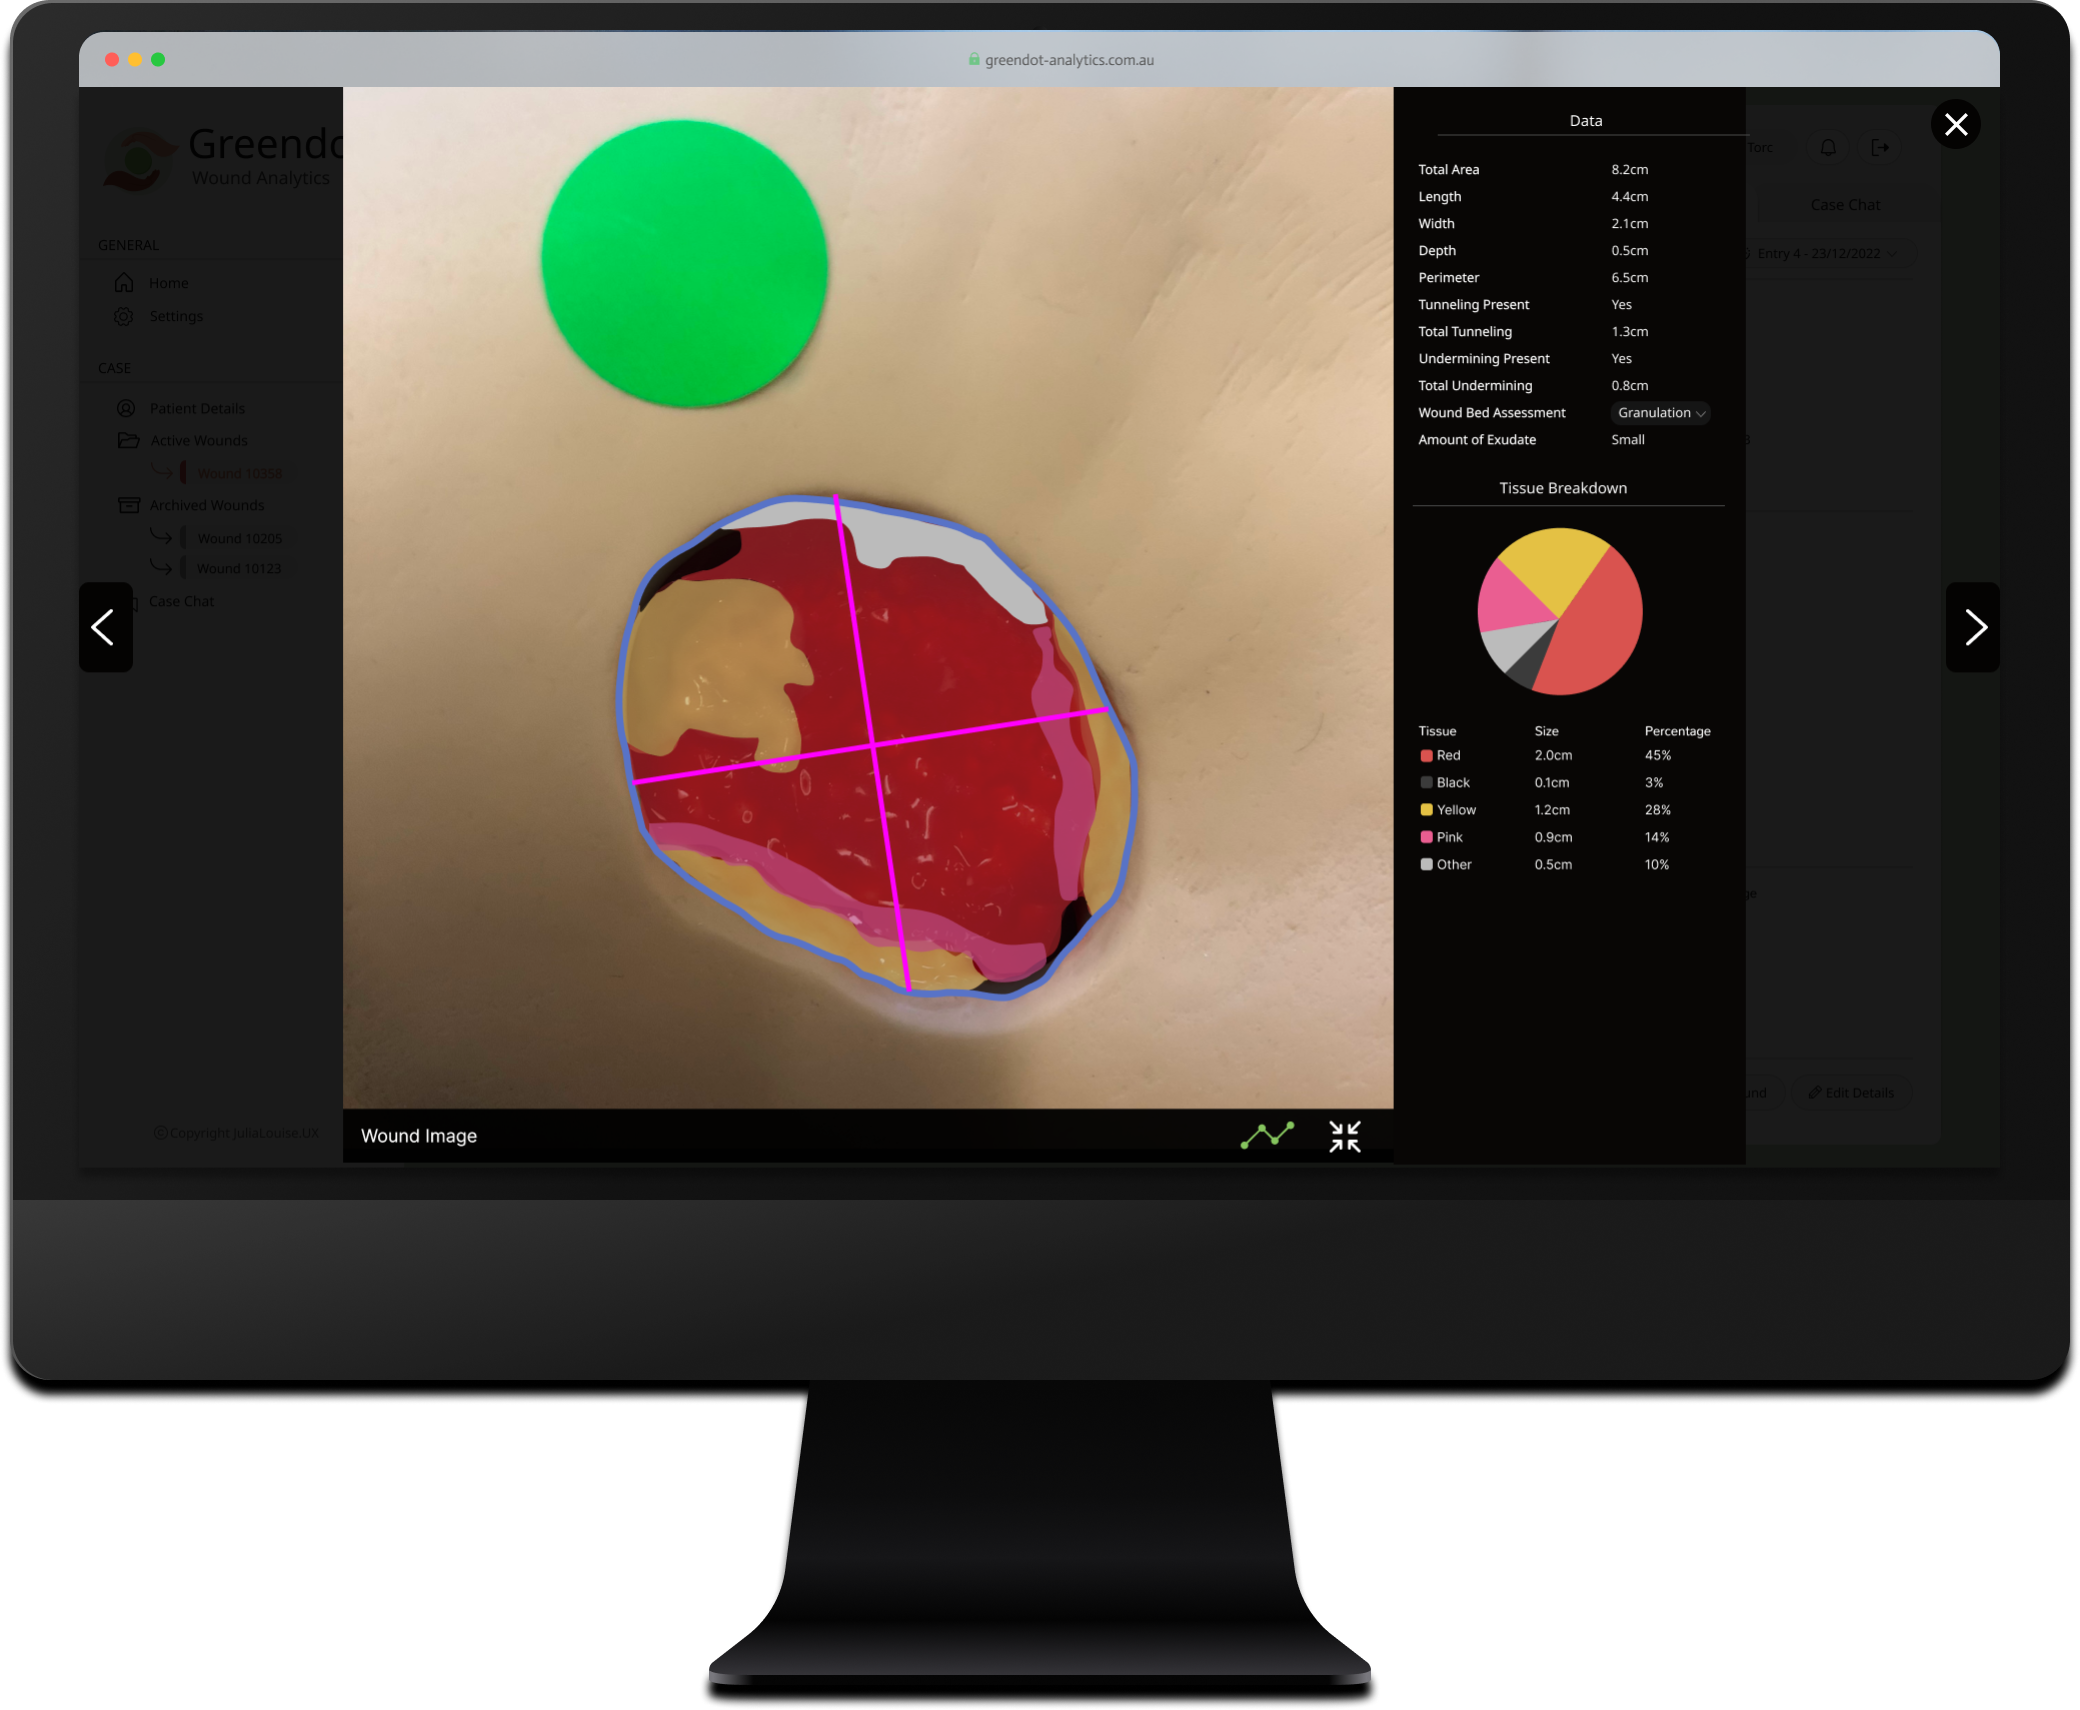
Case files contain all information captured by front-line staff using the mobile app. Clinicians can track and manage wound data, treatment information, and patient medical details, with detailed records that include historical data and changes over time. The system also supports the management of multiple wounds from one central place, enabling comprehensive care for patients with more than one.
Clinicians are able to respond directly within a patient's case file when a front-line carer requests assistance through the mobile app. From here, clinicians can complete a standard response form to diagnose the wound and prescribe appropriate treatment. Additionally, there is a direct communication channel that allows messaging between clinicians and front-line carers, enabling them to ask questions and collaborate when providing medical care to the patient.
Greendot Analytics transformed wound care management, cutting treatment times from 7-14 days to under 48 hours - an 85% improvement. The streamlined workflows allowed carers to create cases 60% faster, clinicians to measure wounds 90% quicker, and specialists to respond 75% faster. These advancements showcased GDA's ability to set a new standard for efficiency and care in aged care facilities, though its journey was ultimately impacted by unforeseen challenges.

As the MVP of the software neared completion and the team prepared for trials in aged care facilities, the pandemic struck. In Melbourne strict lockdowns were enforced for most of the year, effectively closing aged care centers to the public, including our team. Since Greendot Analytics relied on in-person data collection through the app, the solution couldn't be rolled out and, unfortunately, was discontinued before it could even launch.
This case study includes a full walkthrough of the research, design and prototyping process.
Initially I was presented with a functional requirements document that the product manager had put together. The Product manager had already conducted interviews and derived insights from wound specialists and aged care managers. From the data presented I was able to determine the following for the MVP of the product:
This solution involved three primary user groups directly interacting with the software, plus the patients as an indirect user group. To build empathy and address the diverse needs of these users, I developed a series of user personas. Each persona represented distinct characteristics, frustrations, and requirements, which also helped facilitate discussions during the design process.


Before designing the system, I created storyboards based off two primary use cases to visualize how the solution could function in the real-world. This step was crucial given the complexity of the software, which comprised two closely integrated systems: a mobile app and a web portal. The intricacies increased as the workflow and use cases were often initiated by different user groups. For example, one user might create a case on the mobile app, prompting a notification to another user who would then need to take action on the web portal. This storyboard helped clarify these interactions, ensuring a comprehensive understanding of the overall user experience.


The first step in this phase of the project involved creating two release maps to prioritize the feature sets for the solution. Collaborating with the Product Manager, we created one release map for the mobile app, designed primarily as a wound-data capture system for front-line aged care workers. The second release map focused on the accompanying web application, which was intended to serve as a platform for coordinators to manage cases, users, and organizations, as well as for clinicians to oversee and provide wound care in aged care facilities.


To map out the system's overall structure and hierarchy I developed one sitemap for the mobile app and one for the web application. These diagrams were crucial in defining the distinct user roles and their interactions within different parts of the system.


Subsequently, I created system task flows for the mobile and web app to clarify how the user processes for each platform could work.


Low-fidelity prototypes were developed based on the overall structure & process defined in the previous diagrams and documents provided by the Product Manager that outlined the required data fields. These fields were carefully selected and refined by the PM, who collaborated closely with wound clinicians to ensure the solution prioritized the most relevant data for treatment escalation. Significant time was spent to determine not only the set of data fields but also ones that would be enforced with validation. This was important as we recognized that front-line staff might not always have the time to fill in every data field while caring for residents.
System WireflowsThis part of the design process was by far the most iterative and challenging. The collaboration sessions the Product Manager held with various stakeholders revealed conflicting priorities based on different user roles. While the web application workflow required only a few iterations, the mobile app flows - such as creating a case, updating a case, and handling deviations like requesting a response - underwent more than ten iterations. Ultimately, a flow was agreed upon after the PM presented a range of options to each stakeholder. Even so, it was acknowledged that further research and usability testing would likely be needed during the aged care center trials. The development team was advised to plan for future tweaks to the flows once the MVP version of the app was released.


Prior to working on the high-fidelity wireframes, I assembled a UI kit with reusable components. This kit was key to achieving a cohesive, brand-consistent, and visually engaging design across both the web & mobile app.

In Figma, I created high-fidelity designs for the web portal and the mobile app. The design required the use of various colors to convey different statuses and meanings, so I opted for a light, neutral color palette wherever possible to prevent overwhelming the user and to ensure the key elements stood out. Below is the final wireframe set, showcasing the design of each page.

Throughout the design process, several key iterations were completed to address usability challenges and incorporate feedback from stakeholders, including clinicians and aged care managers - the domain experts in the field. These iterations were informed by insights gathered during collaboration sessions, ensuring the final MVP effectively met the practical needs of its users. Below is a summary of the most impactful iterations that shaped the product.


Prior to starting development, I presented the solution to the engineering team and answered any questions before coding began. To conclude the design process, a complete set of wireframes and design notes was handed over. My role then shifted to front-end developer where I worked with the team to deliver the initial version of the Greendot Analytics web application and mobile app.