BoardInsight Dashboard
Empowering Company Secretaries to streamline board governance and ensure compliance.
Read Case Study
Empowering Company Secretaries to streamline board governance and ensure compliance.
As part of a software suite for board management, I was tasked with redesigning the Analytics Dashboard module, tracking board performance, providing key metrics and insights, and ensuring compliance.

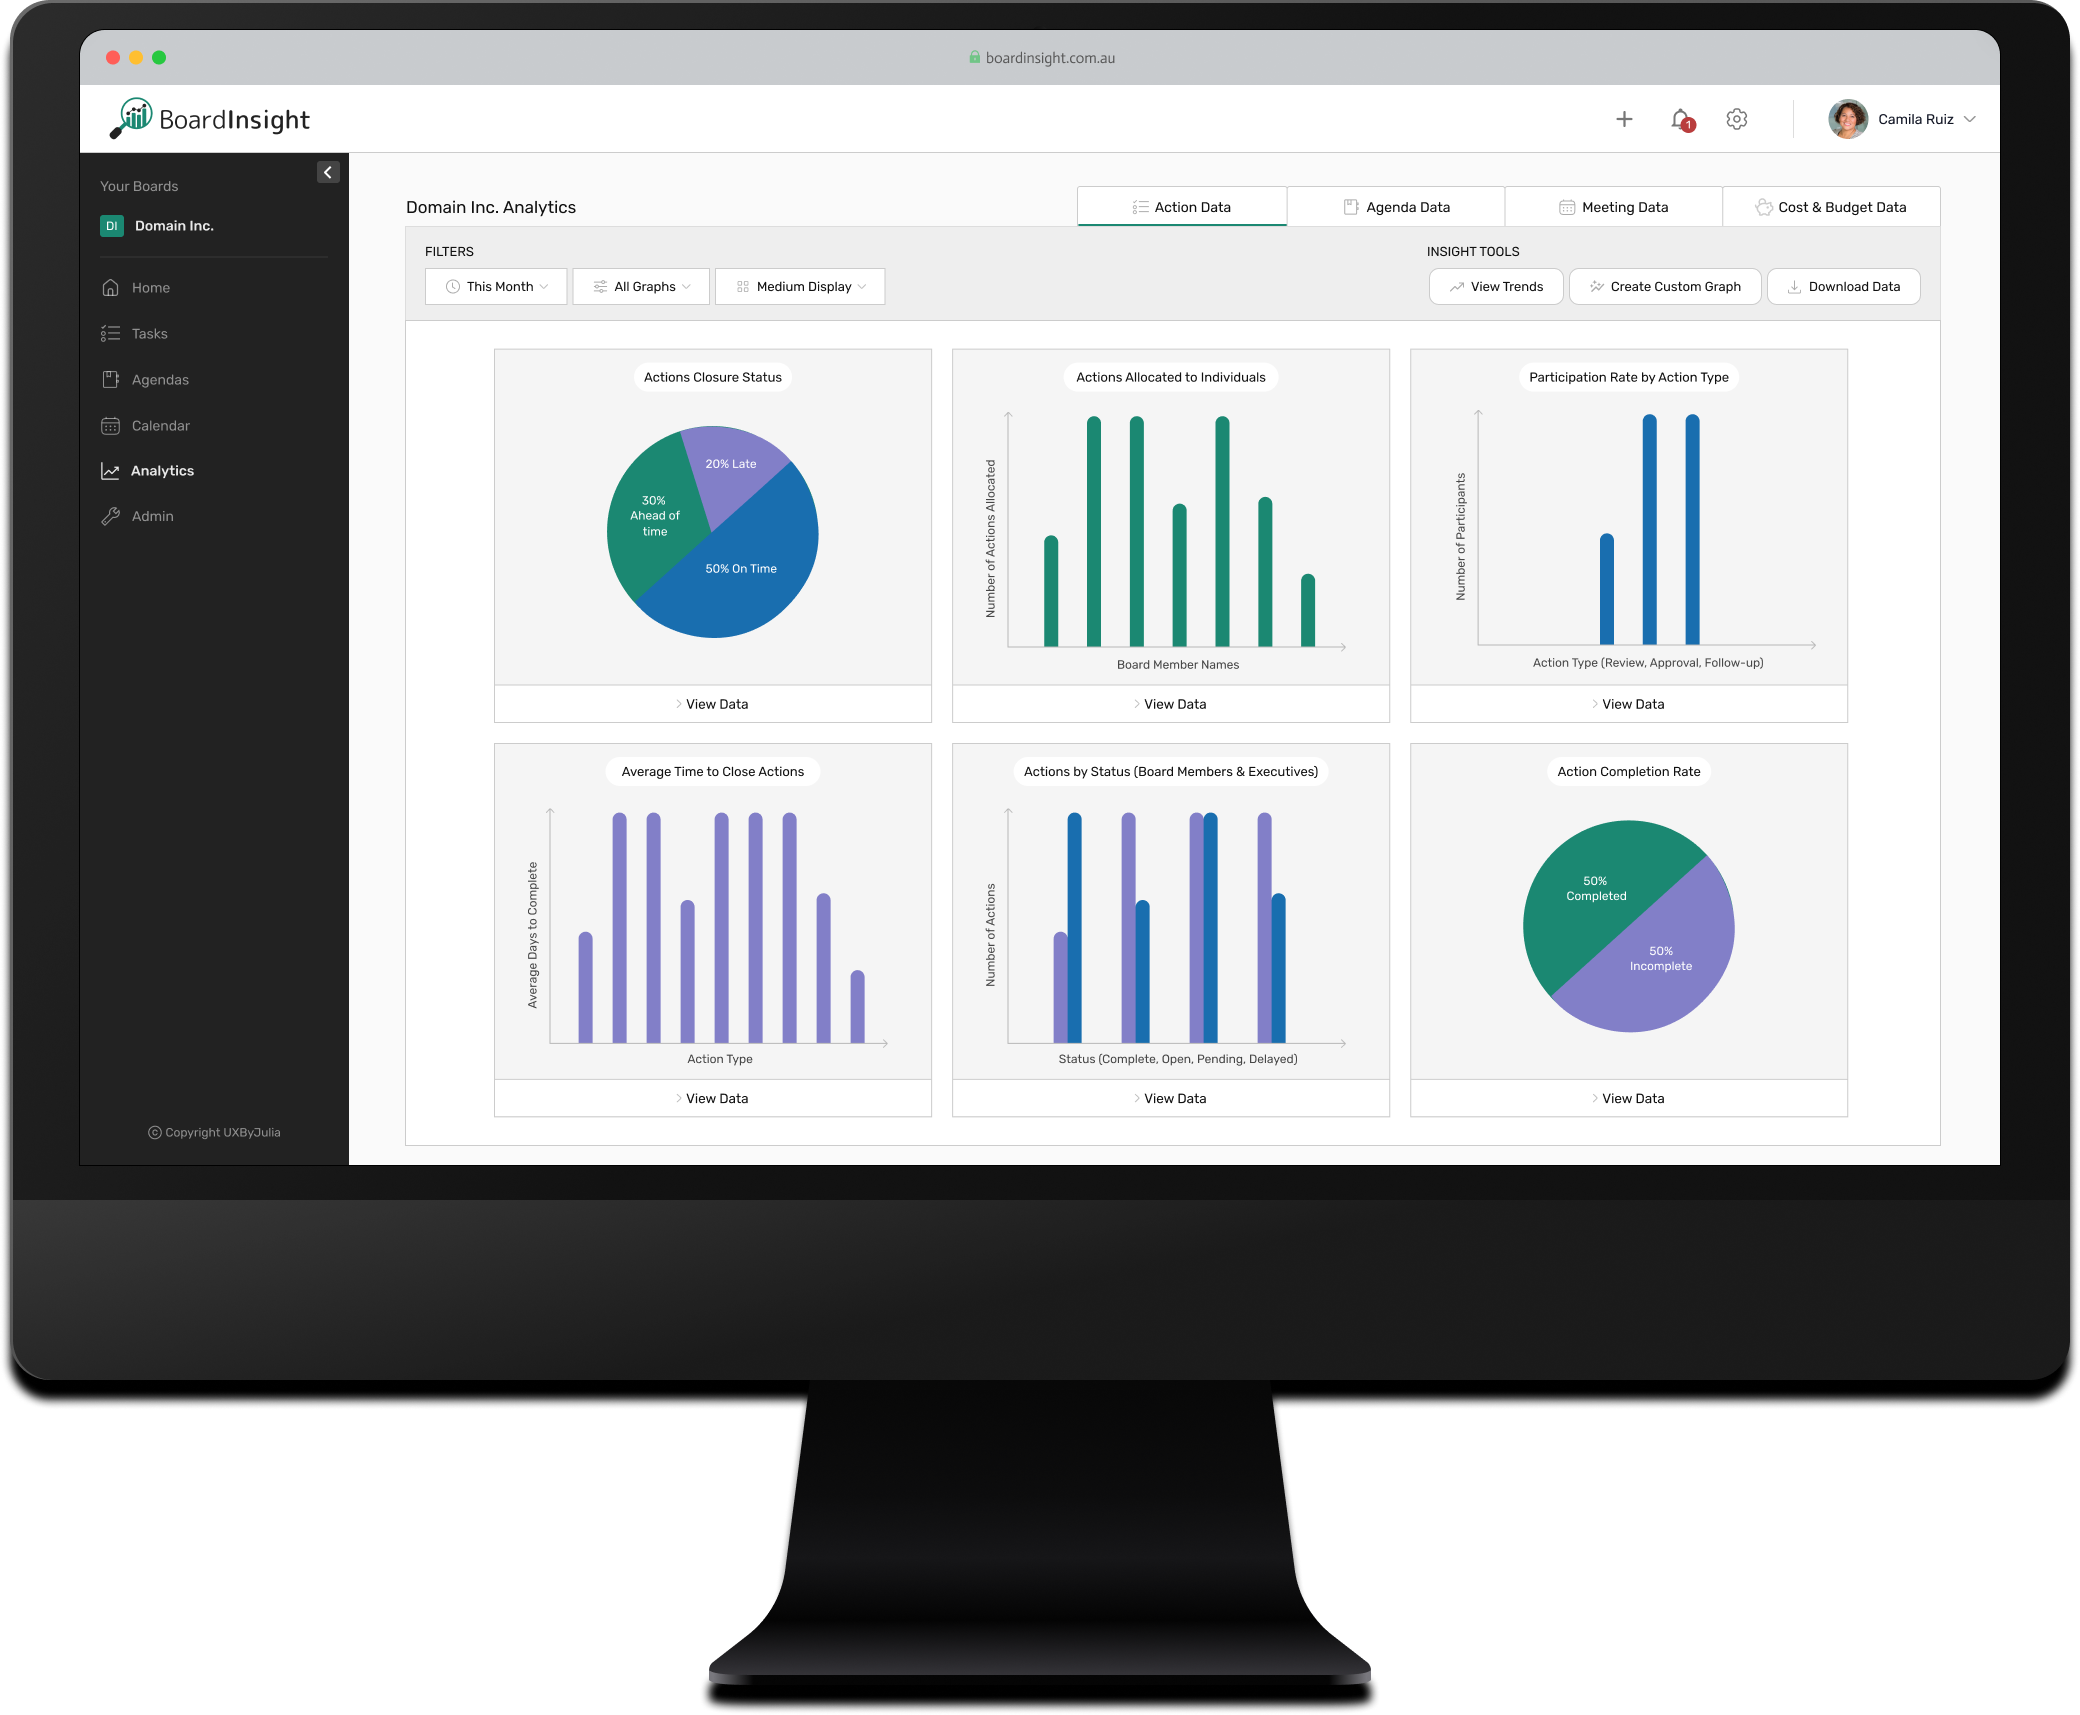
Effective board governance requires constant monitoring to ensure performance, compliance, and operational efficiency. For company secretaries, success depends on accurate record-keeping, clear communication, and meeting compliance targets, but these tasks are often slowed by outdated manual processes. The existing dashboard at BoardInsight failed to support these needs, offering unstructured data with limited filters and features. Without intuitive tools to explore key metrics or drill down into actionable insights, users were left overwhelmed and unable to efficiently track performance.
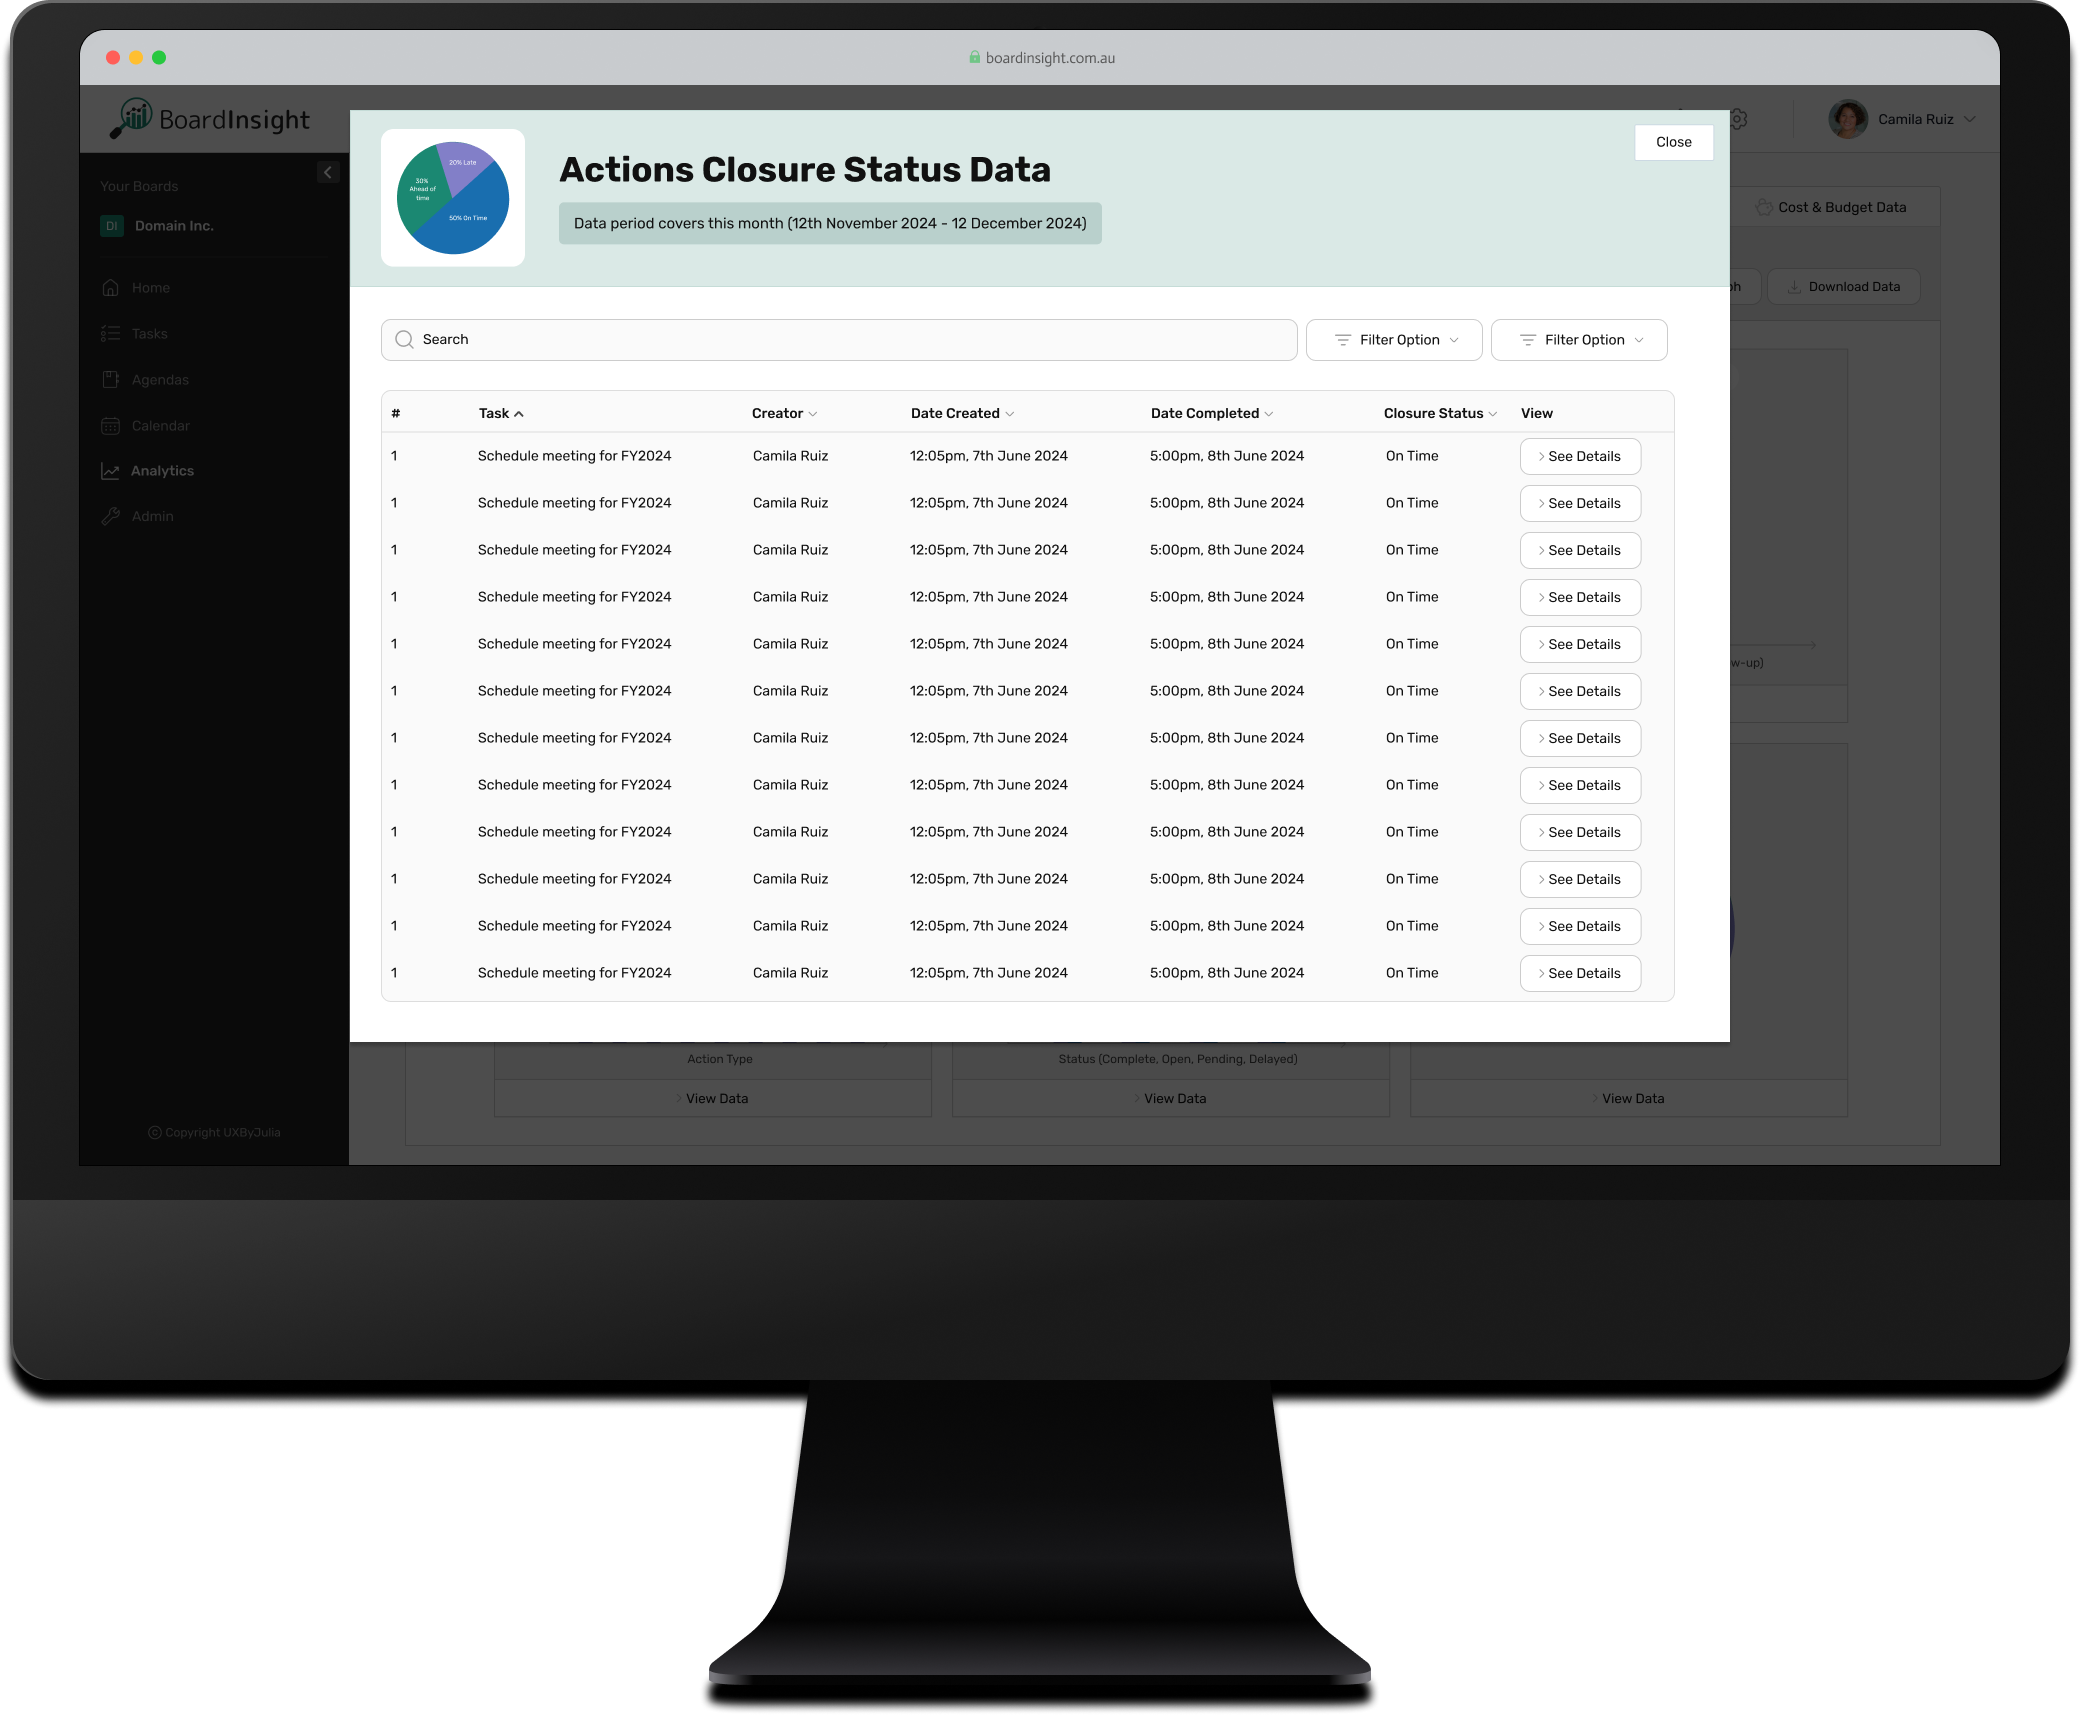
I redesigned the Analytics Dashboard to simplify data presentation, making it easier for company secretaries to monitor governance and compliance. The solution logically partitioned datasets to reduce overwhelm, introduced filtering and drill-down tools for deeper analysis, and prioritised user-friendly workflows to help users quickly find the information they needed for compliance purposes.
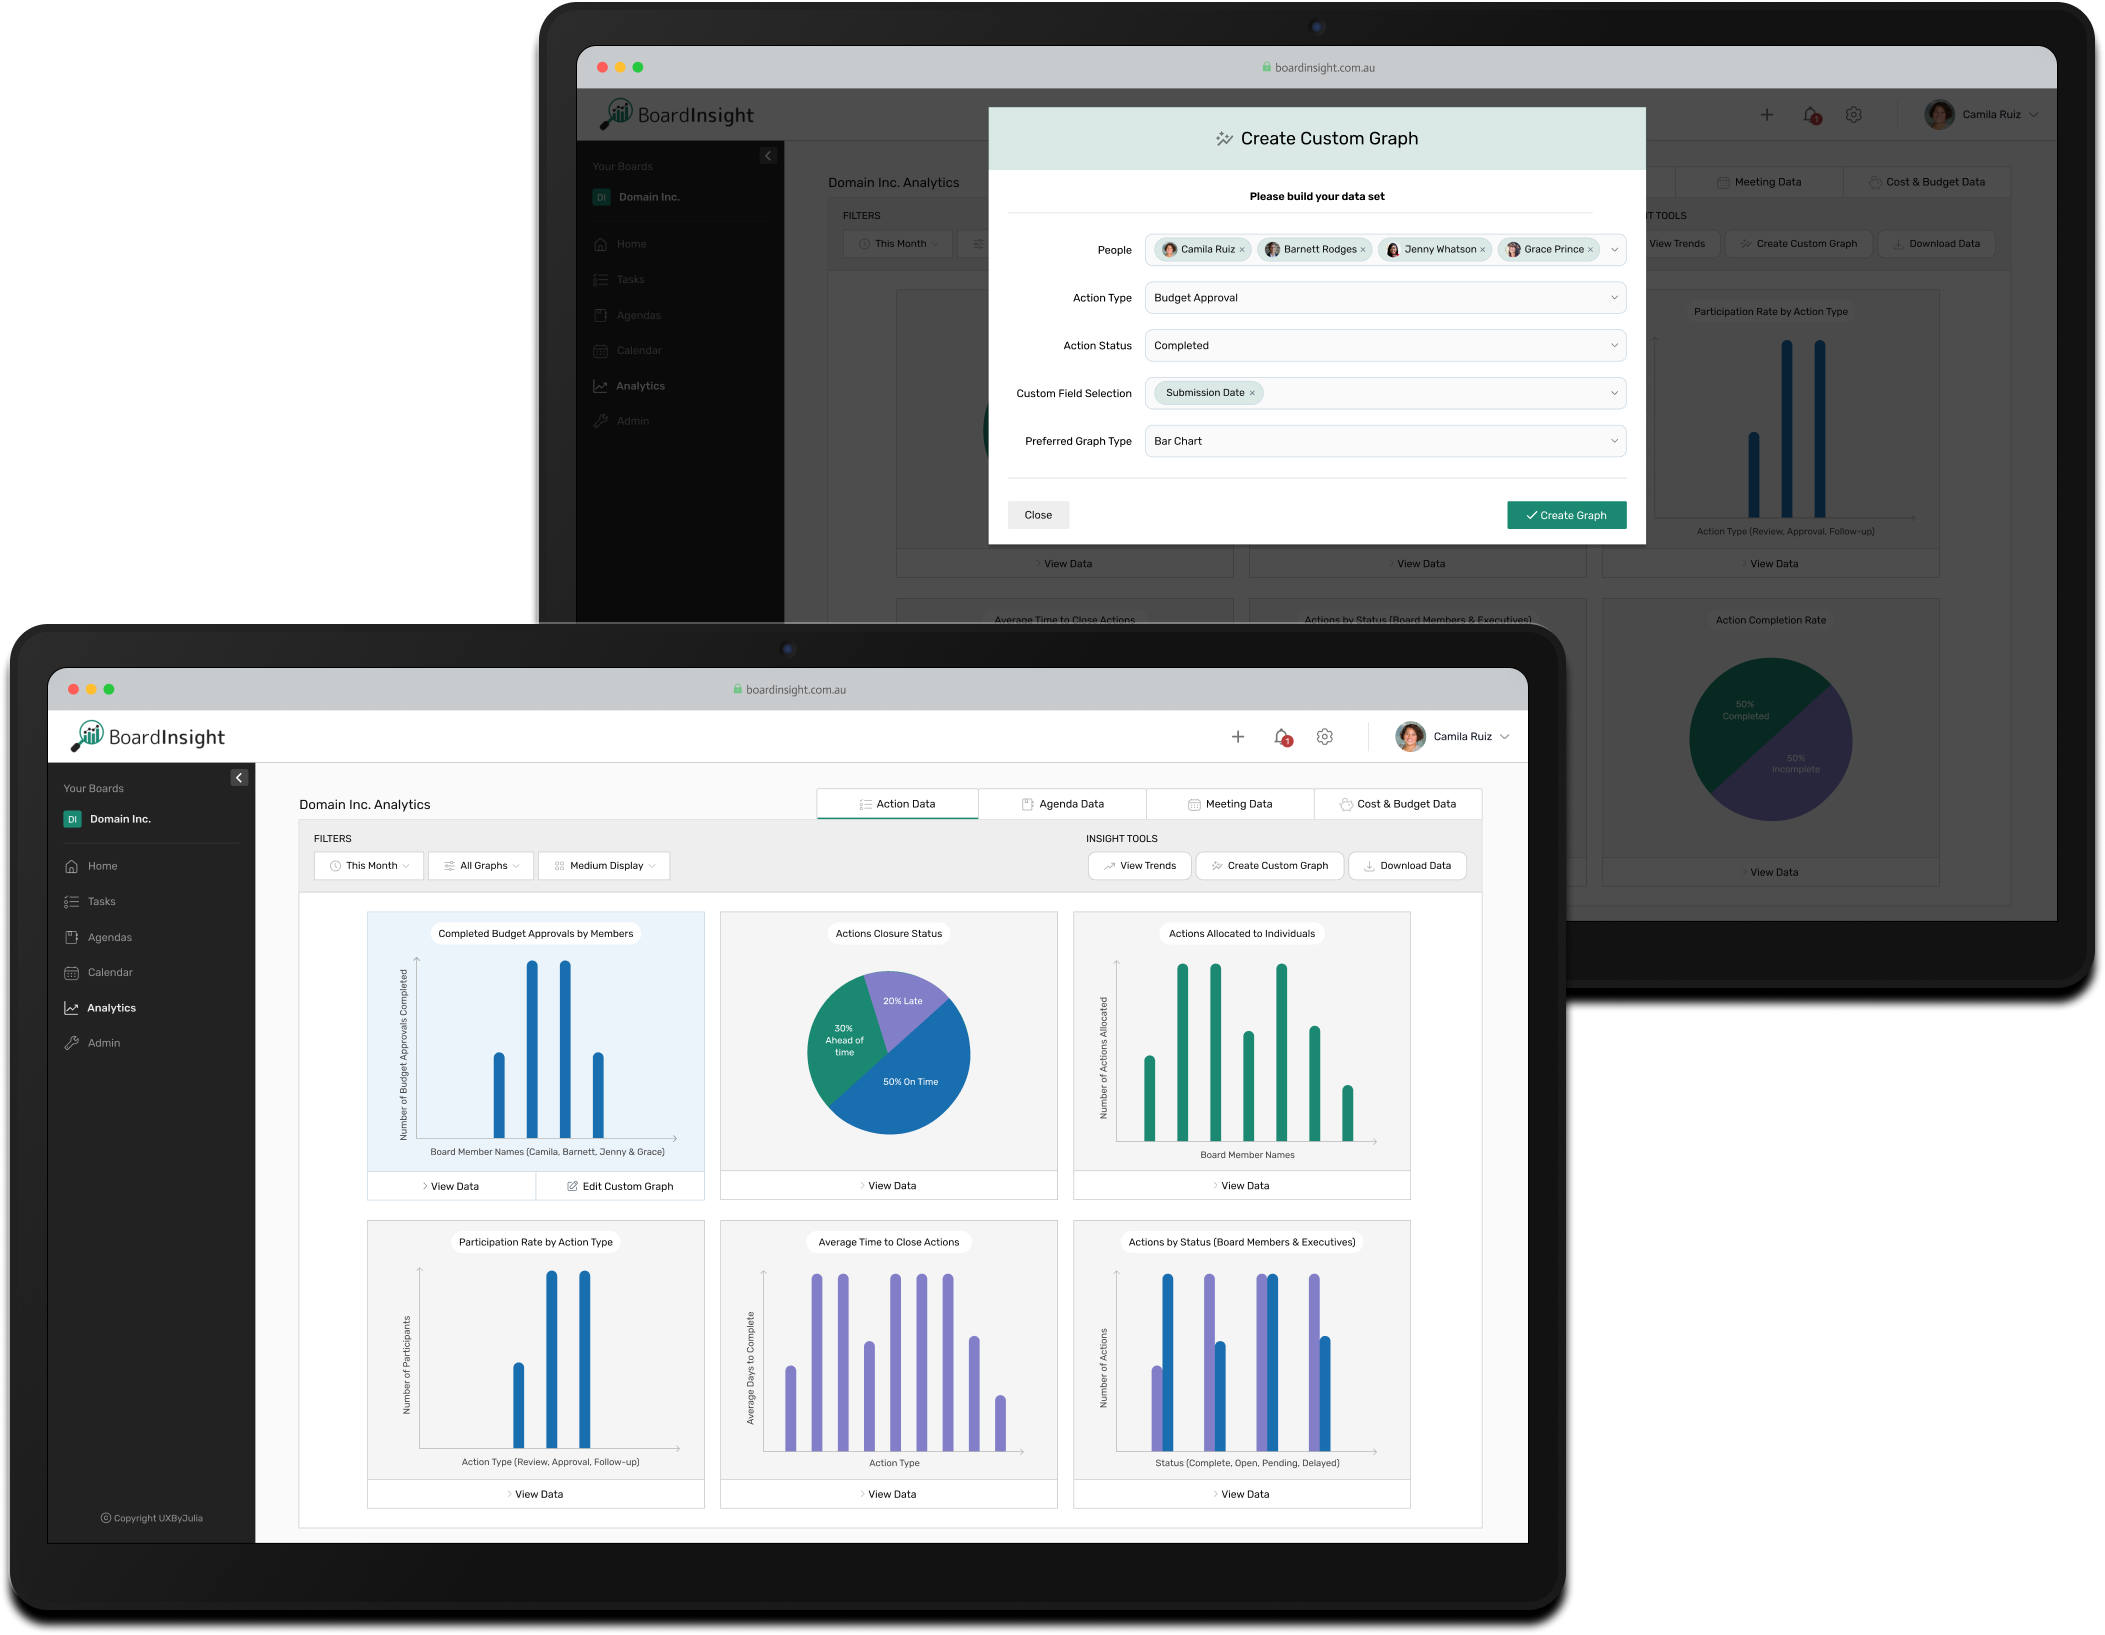
Advanced filtering and customisation options empower users to tailor their dashboard views by time periods, data categories, or display preferences - helping them focus on the metrics that matter most.
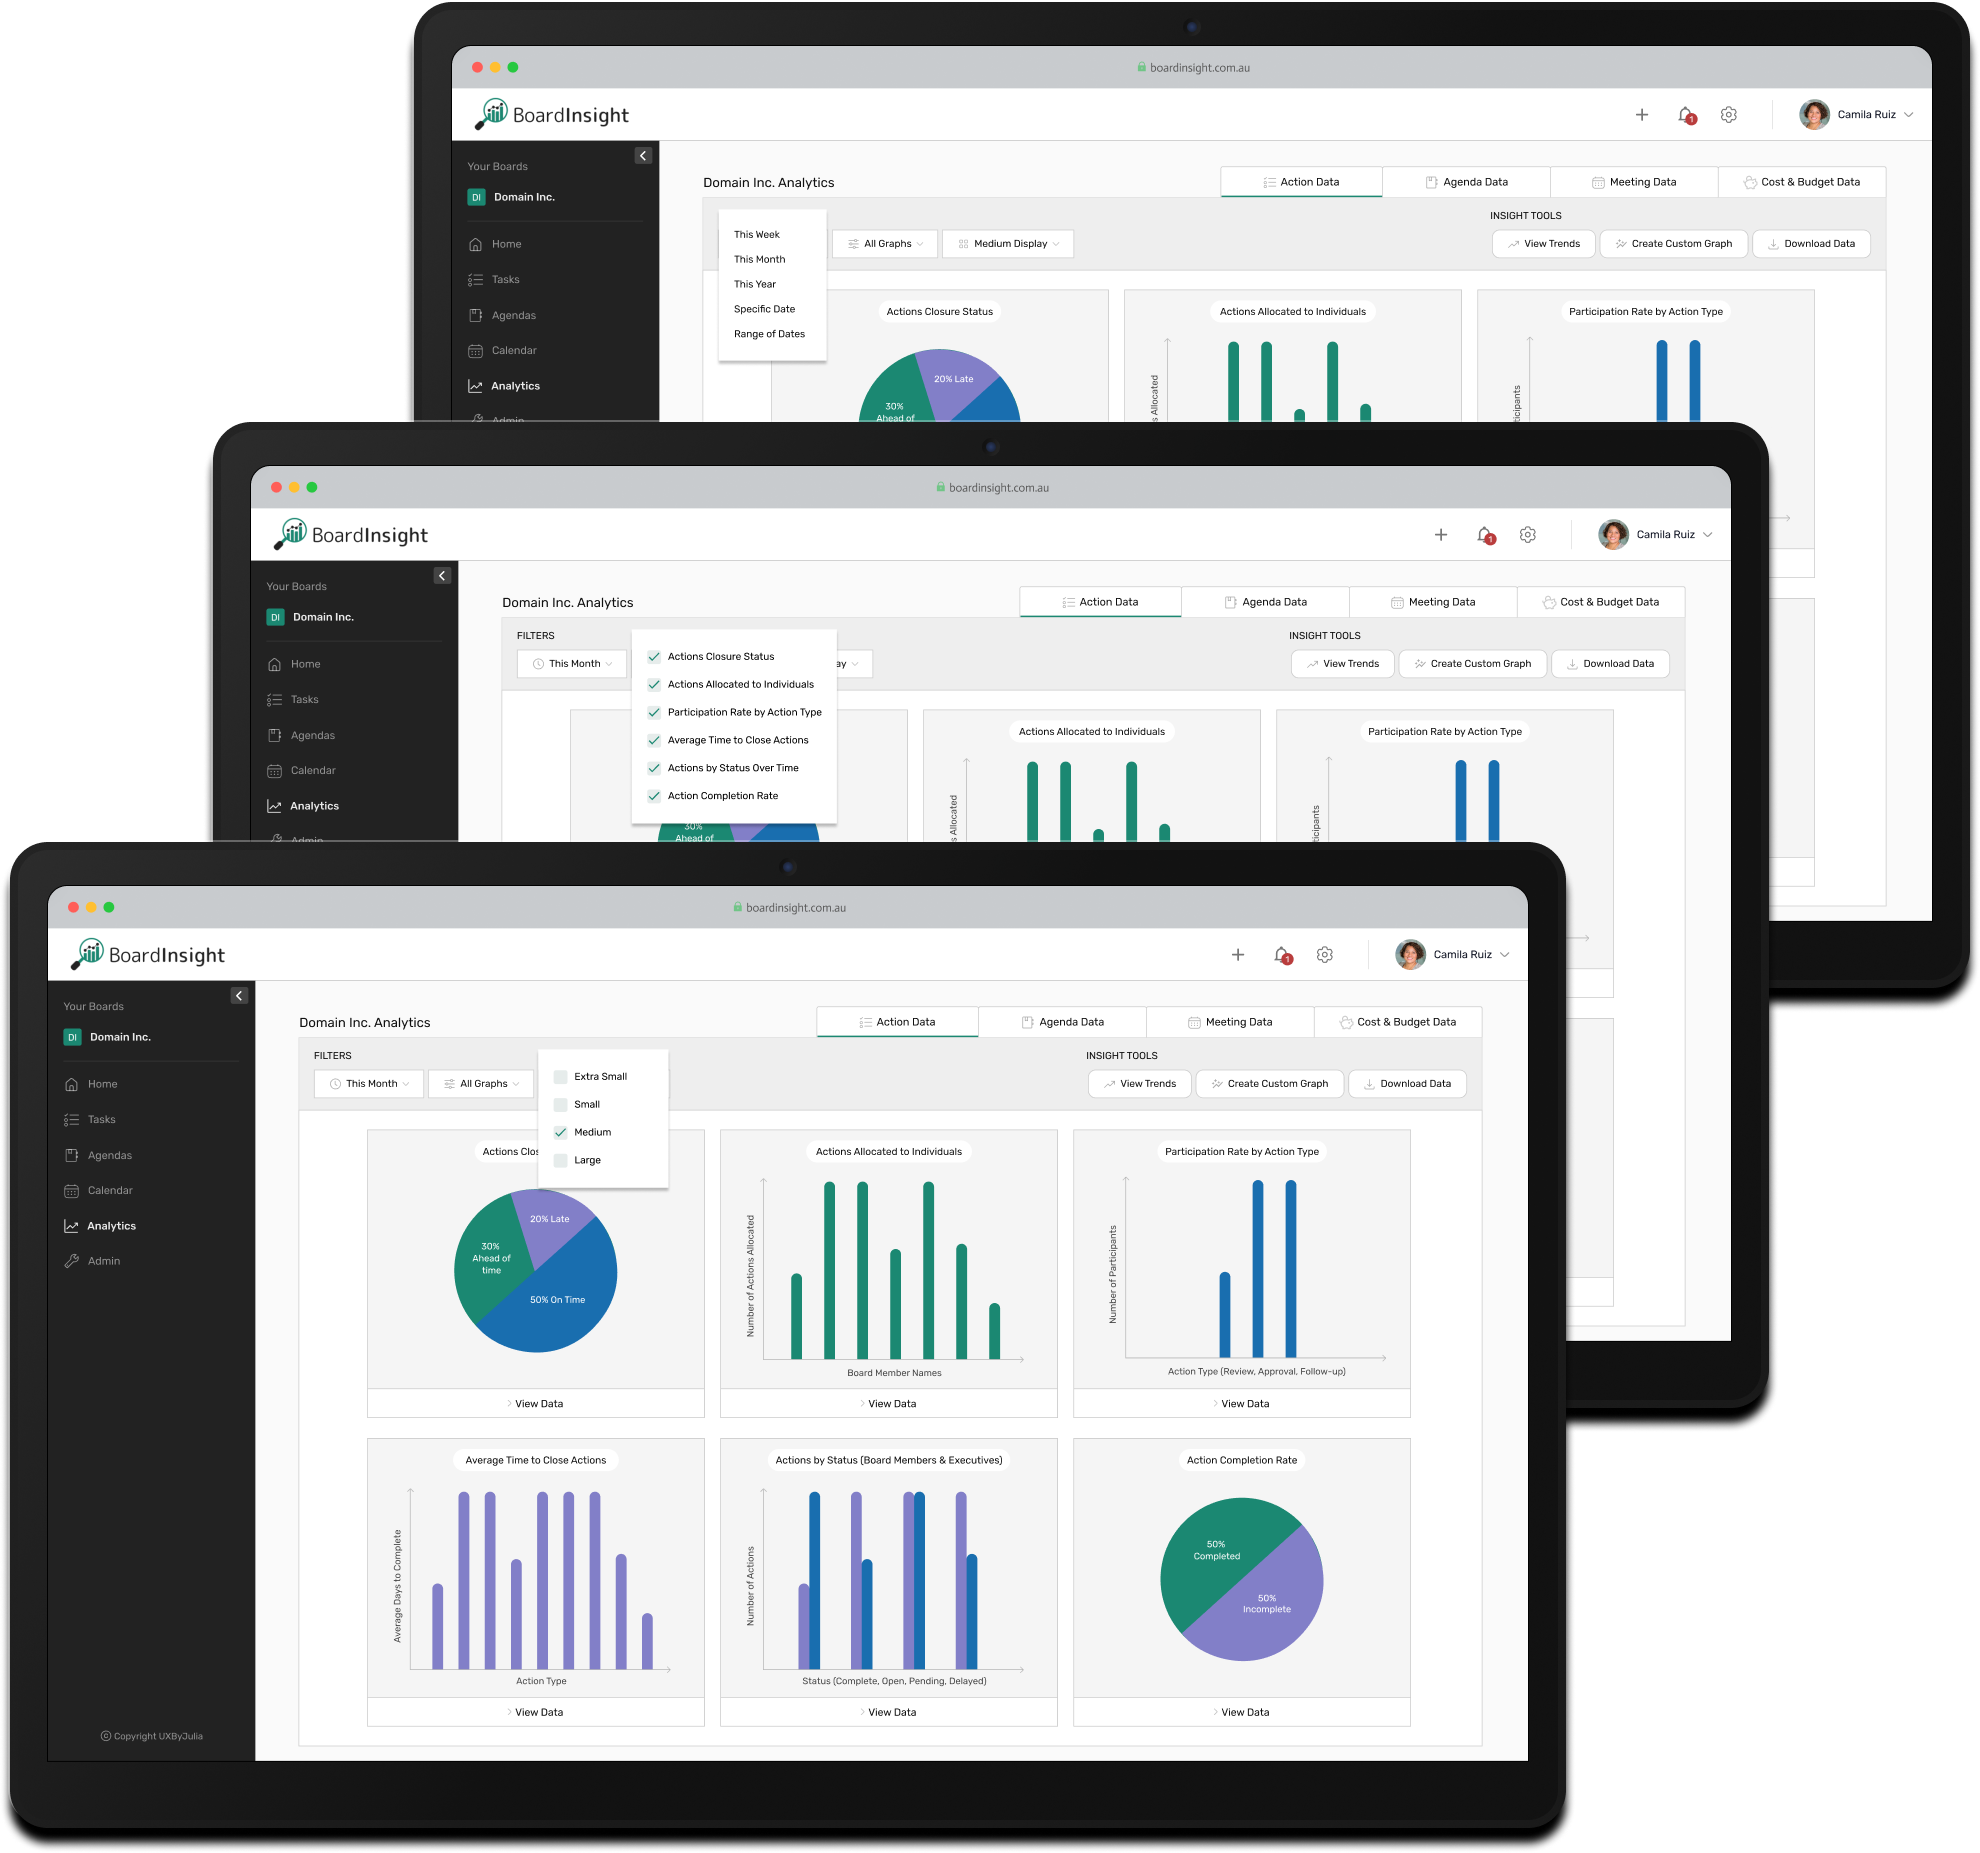
The Create Custom Graphs feature empowers company secretaries and chairmen to design tailored graphs from specific data sets relevant to their needs, facilitating easy analysis of bespoke metrics.
Explore how BoardInsight empowers company secretaries with real-time insights and actionable data in this interactive prototype.